


19Chapter 4 Making a Measurement
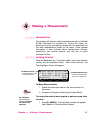
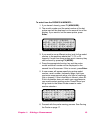
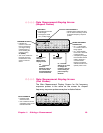
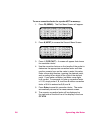
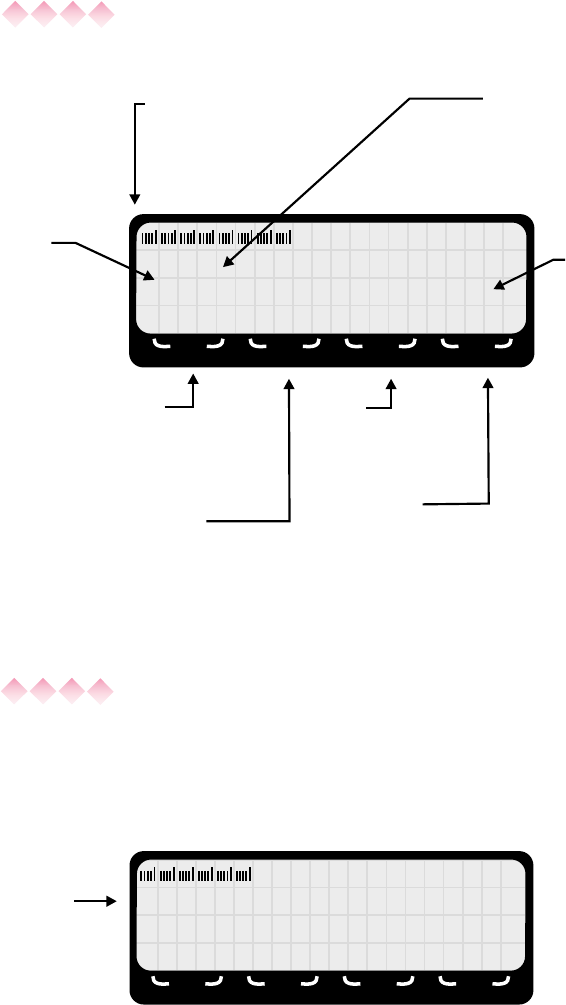
Main Measurement Display Screen
(Shaped Probes)
12. 1 % STD
27.5 MAX CF 1.00
ALT MAXR MENU FREQ
F1 F2 F3 F4
FIELD STRENGTH
•
Indicates actual measured value
•
Unit of measure is always % STD
for shaped frequency response
probes
BAR GRAPH
•
Indicates approximate
field strength
•
100 segment, three
10:1 (10 dB) ranges
MAXIMUM VALUE
•
Indicates the
maximum value that
has occurred since
you began making
measurements or
since resetting the
maximum using
F2 (MAXR)
•
The unit of measure is
the same as for the
instantaneous value
shown on the line
above.
PROBE FREQUENCY
CORRECTION
•
CF = 1.00 indicates
no correction factor is
being applied
•
CF= X.XX indicates
the numeric value that
is being applied
•
A frequency displayed
here indicates that the
meter is applying a
correction factor
based on the stored
calibration data for the
specific probe in use.
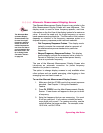
F1
Change to the
Alternate
Measurement
Display Screen
F2
Reset the
Maximum Value to
the current Field
Strength displayed
on the second line
F3
Go to the First
Menu Screen
F4
Allows you to enter
or change the
frequency that you
are correcting for
probe frequency
deviation
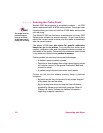
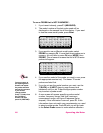
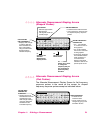
Main Measurement Display Screen
(Flat Probes)
The Main Measurement Display Screen for flat frequency
response probes is the same as the screen for shaped
frequency response probes except as indicated below.
6.26 /Wmcm
2
11.5 MAX CF 1.00
ALT MAXR MENU FREQ
F1 F2 F3 F4
FIELD STRENGTH
•
Indicates actual
measured value
•
Unit of measure can be
changed by going to the
First Menu Screen