ProSecure Unified Threat Management UTM10 or UTM25 Reference Manual
11-16 Monitoring System Access and Performance
v1.0, September 2009
To clear the statistics, click Clear statistics.
To set the poll interval:
1. Click the stop button.
2. From the Poll Interval pull-down menu, select a new interval (the minimum is 5 seconds, the
maximum is 5 minutes).
3. Click the set interval button.
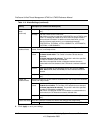
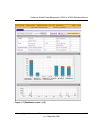
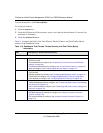
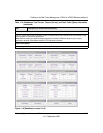
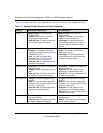
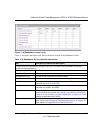
Table 11-6 explains the fields of the Total Threats, Threats (Counts), and Total Traffic (Bytes)
sections of the Dashboard screen.
Table 11-6. Dashboard: Total Threats, Threats (Counts), and Total Traffic (Bytes)
Information
Item Description (or Subfield and Description)
Total Threats
Emails Displays the total number of:
• Scanned e-mails.
• Viruses detected (to configure, see “Customizing E-mail Anti-Virus and Notification
Settings” on page 6-5).
• E-mails that matched filters (to configure, see “E-mail Content Filtering” on page 6-8).
• Spam (to configure, see “Protecting Against E-mail Spam” on page 6-11).
Web Displays the total number of:
• Files scanned.
• Malware detected (to configure, see “Configuring Web Malware Scans” on page 6-21).
• Files blocked (to configure, see “Configuring Web Content Filtering” on page 6-23).
• URLs blocked (to configure, see “Configuring Web URL Filtering” on page 6-30).
IM/Peer to Peer Displays the total number of:
• Instant Messaging blocked (to configure, see “Customizing Web Protocol Scan Settings
and Services” on page 6-19).
• Peer to Peer blocked (to configure, see “Customizing Web Protocol Scan Settings and
Services” on page 6-19).
Network Displays the total number of:
• IPS attack signatures matched (to configure, see “Using the Intrusion Prevention
System” on page 5-47).
• Port scans detected (to configure, see “Using the Intrusion Prevention System” on
page 5-47).


