


Commands by Subsystem 3
Agilent InfiniiVision 5000 Series Oscilloscopes Programmer's Reference 405
This data is transmitted over the interface linearly, starting with time
bucket 0 and proceeding through time bucket n-1, where n is the number
returned by the :WAVeform:POINts? query (see page 413). The first value
corresponds to a point at the left side of the screen and the last value
corresponds to one point away from the right side of the screen. The
maximum number of points that can be returned in average mode is 1000
unless ACQuire:COUNt has been set to 1.
PEAK Data
Peak detect display mode is used to detect glitches for time base settings
of 500 us/div and slower. In this mode, the oscilloscope can sample more
data than it can store and display. So, when peak detect is turned on, the
oscilloscope scans through the extra data, picks up the minimum and
maximum for each time bucket, then stores the data in an array. Each
time bucket contains two data sample.
The array is transmitted over the interface bus linearly, starting with time
bucket 0 proceeding through time bucket n- 1, where n is the number
returned by the :WAVeform:POINts? query (see page 413). In each time
bucket, two values are transmitted, first the minimum, followed by the
maximum. The first pair of values corresponds to the time bucket at the
leftmost side of the screen. The last pair of values corresponds to the time
bucket at the far right side of the screen. In :ACQuire:TYPE PEAK mode
(see page 132), the value returned by the :WAVeform:XINCrement query
(see page 428) should be doubled to find the time difference between the
min- max pairs.
HRESolution Data
The high resolution (smoothing) mode is used to reduce noise at slower
sweep speeds where the digitizer samples faster than needed to fill
memory for the displayed time range. This mode is the same as the
AVERage mode with :ACQuire:COUNt 1.
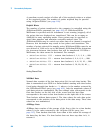
Data Conversion
Word or byte data sent from the oscilloscope must be scaled for useful
interpretation. The values used to interpret the data are the X and Y
references, X and Y origins, and X and Y increments. These values are
read from the waveform preamble. Each channel has its own waveform
preamble.
In converting a data value to a voltage value, the following formula is
used:
voltage = [(data value - yreference) * yincrement] + yorigin
If the :WAVeform:FORMat data format is ASCii (see page 412), the data
values are converted internally and sent as floating point values separated
by commas.