ProSecure Unified Threat Management UTM10 or UTM25 Reference Manual
11-46 Monitoring System Access and Performance
v1.0, September 2009
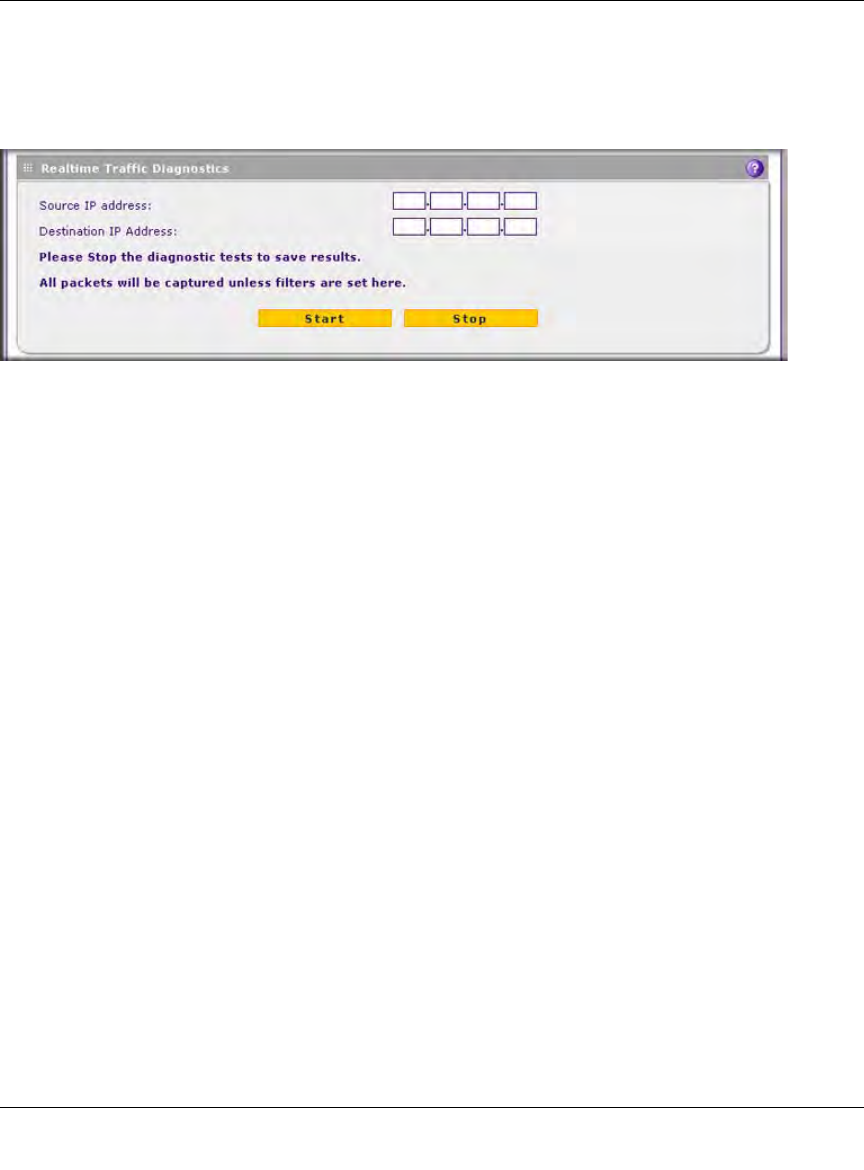
Using the Realtime Traffic Diagnostics Tool
This section discusses the Realtime Traffic Diagnostics section and the Perform a DNS Lookup
section of the Diagnostics screen.
You can use the Realtime Traffic Diagnostics tool to analyze traffic patterns with a network traffic
analyzer tool. Depending on the network traffic analyzer tool that you use, you can find out which
applications are using most bandwidth, which users use most bandwidth, how long users are
connected, and other information.
To use the Realtime Traffic Diagnostics tool:
1. Locate the Realtime Traffic Diagnostics section on the Diagnostics screen.
2. In the Source IP address field, enter the IP address of source of the traffic stream that you want
to analyze.
3. In Destination IP address, enter the IP address of the destination of the traffic stream that you
want to analyze.
4. Click Start. You are prompted to save the downloaded traffic information file to your
computer, however, do not save the file until you have stopped capturing the traffic flow.
5. When you want to stop capturing the traffic flow, click Stop.
6. Select a location to save the captured traffic flow. (The default file name is
diagnostics.result.dat.) The file downloads to the location that you specify.
7. When the download is complete, browse to the download location you specified and verify
that the file has been downloaded successfully.
8. Send the file to NETGEAR Technical Support for analysis.
Figure 11-27 [Diagnostics, screen 2 of 3]
