Chapter 5 315
One-Button Measurement Functions
MEASURE (Spectrum Analysis Mode)
One-Button Measurement Functions
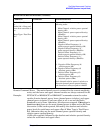
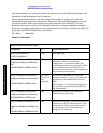
Remote Command Notes: To save trace data use the fetch methods shown above.
Example: FETC:PST? or MEAS:PST? or READ:PST?
FETC:PST2? or MEAS:PST2? or READ:PST2?
FETC:PST3? or MEAS:PST3? or READ:PST3?
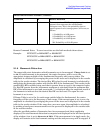
5.1.8 Harmonic Distortion
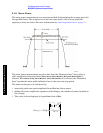
Therangetablestatedetermineswhichharmonicsaretobemeasured.IfRange Table is set
to Off, for each harmonic to be measured, the center frequency will be set to the
appropriate integer multiple of the fundamental frequency and a sweep taken. The
amplitude is calculated by averaging the power in the trace and is displayed in the results
table in the results window. The desired Res BW value for each harmonic is calculated by
multiplying the harmonic number with the Res BW of the fundamental. This results in the
smallest Res BW available being used that is greater than or equal to the computed value.
If a Res BW greater than the instrument maximum is calculated then the maximum Res
BW of the instrument is used and an asterisk (*) is displayed after the amplitude result of
the harmonic to indicate that the desired Res BW was not used. The span for each
harmonic is set to zero.
If Range Table is set to On, for each range enabled after the fundamental, the center
frequency will be set to the frequency of each range. If the current span is set to zero, the
amplitude is calculated by averaging the power in the trace and is displayed in the results
table in the results window. If the range has a non-zero span, the amplitude is calculated
by making a band-power measurement over the span and is displayed in the results table
in the results window.
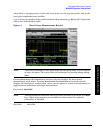
After the specified number of harmonics have been measured and their amplitudes
displayed, the total harmonic distortion is computed and displayed in the left-hand portion
of the window (view is set to
Harmonics & THD). If the measurement is in single mode, the
display will remain at the last harmonic setting and the analyzer sweep will be stopped. If
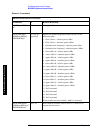
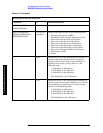
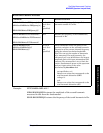
n=4 Returns a series of 501 floating point numbers (in
percent) that represent the user-definable
reference trace. This is the probability that at
specific power levels (average power) will occur, as
follows:
1. Probability at 0 dB power
2. Probability at 0.1 dB power
3. Probability at 0.2 dB power
…
501.Probability at 50.0 dB power
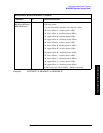
Measurement Results Available (Continued)
Command n Results Returned


