Using the CLI Shell
ROS™ v3.5 248 RS400
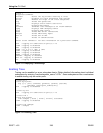
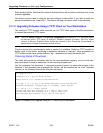
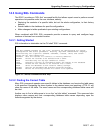
Figure 175: Displaying Trace settings
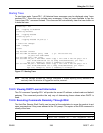
Enabling Trace
Tracing can be enabled on a per subsystem basis. Obtain detailed information about individual
subsystems by entering “trace subsystem_name ?<CR>”. Some subsystems offer a mechanism
to enable tracing only on certain ports.
Figure 176: Enabling Trace
>trace stp ?
trace stp syntax:
stp [-|+] [all] [verbose] [packets] [timers] [actions]
[decodes] [ports[port_number|all]]
STP : Logging is disabled
>trace stp all
STP : Logging all conditions on port(s) 1-16
>trace link ?
trace link syntax
link changes | stats | allon | alloff | statsonce
LINK : Logging is disabled
>trace link changes
LINK : changes
>
trace ?
Supported commands:
noclear Starts the log without clearing it first
alloff Disables all trace subsystems from tracing
allon Enables all flags in all trace subsystems
stp Traces STP operations
link Displays switch fabric statistics
mac Displays MAC Events
forward Forwards trace messages to an IP:UDP address
igmp Displays IGMP Snooping events
gvrp Displays GVRP events
webs Traces Web Server connections
dhcpra Traces DHCP Relay Agent
802.1X Traces 802.1X PAE
ip Traces IP communications
Enter "trace command ?" for more information on a particular command.
STP : Logging all conditions on port(s) 1-10
LINK : Logging is disabled
MAC : Logging is disabled
FORW : IP: 0.0.0.0 UDP: 0 (OFF)
IGMP : Logging is disabled
GVRP : Logging is disabled
WEBS : Logging is disabled
DHCPRA : Logging is disabled
802.1X : Logging is disabled
IP : Logging is disabled


