


92
Dukane Manual Part No. 403–566–01
DPC
™
II Plus and EZ Welder System – User’s Manual
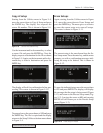
WELD ENERGY P1
MAXIMUM LIMIT
90 J
PROCESS LIMITS
WELD ENERGY P1
WELD ENERGY P2
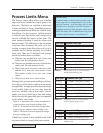
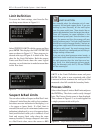
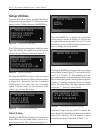
After the minimum and maximum limit values have
been entered, the display returns to the Process Limit
menu shown in Figure 8–3. Logical comparison en-
sures that the minimum value is less than the maxi-
mum value before permitting the value to be en-
tered. The error screen shown in Figure 8–7 ap-
pears briefly and returns to the minimum limit value
entry screen. Reduce the minimum value or press
the
CANCEL key to step back to the maximum limit
value entry screen and increase its value until the
logical condition is satisfied.
After the minimum and maximum values have
been entered, the display shows the Process Lim-
its Menu (Figure 8–3). Press the CANCEL key to
return to the Limit Definition Menu (Figure 8–2).
Press CANCEL again to return to the Process Setup
Menu (Figure 8–1).
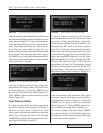
Dual Pressure Mode
If a dual–pressure mode has been programmed,
the limits selection also includes total values in
the Process Limits menu (Figure 8–5). First
choose one of the two top parameters by selecting
either Time or Energy with the cursor. Pressing
the ENTER key displays the limit parameter selec-
tion which is shown in Figure 8–8.
LOWER LIMIT MUST BE
LESS THAN UPPER
LIMIT !
WELD ENERGY
MAXIMUM LIMIT
270 J
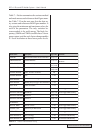
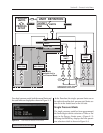
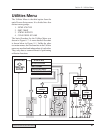
To detect a suspect or bad weld cycle, the mini-
mum and maximum values for each pressure limit
must be set. In dual–pressure mode, a logical de-
cision function (indicated on the flowchart by the
diamond with 2P? inside), diverts the sequence
after the P1 values have been entered and returns
back to the limit selection menu for the P2 value.
You must however move the cursor to the P2 limit
before pressing ENTER otherwise you will return
back through the P1 section. Pressing the CAN-
CEL
key will return you to the P1/P2 selection
menu shown in Figure 8–8. The data entry screens
for dual–pressure mode also identify the P1 or P2
pressure phase. The screen for entering the P1
Maximum Energy Limit is shown in Figure 8–9.
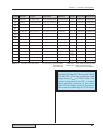
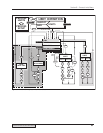
After the minimum and maximum limit values
have been entered, the display returns to the Pro-
cess Limit menu shown in Figure 8–5. Press the
CANCEL key to return to the Limit Definition
Menu (Figure 8–2). Press CANCEL again to re-
turn to the Process Setup Menu (Figure 8–1).
The return sequence flowchart for the CANCEL
key is shown in Figure 8–10. Only the energy loops
are labeled to avoid confusion, but the time loops
have the same return sequence.
Figure 8–9 P1 Maximum Energy Data Entry
Figure 8–7 Minimum Value Error Message
Figure 8–6 Single Pressure Max Energy Data Entry
Figure 8–8 Dual–Pressure Limits Selection Menu