


ProSecure Unified Threat Management UTM10 or UTM25 Reference Manual
11-14 Monitoring System Access and Performance
v1.0, September 2009
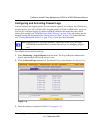
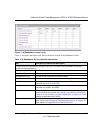
4. Click Apply to save your settings.
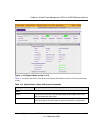
Monitoring Real-Time Traffic, Security, and Statistics
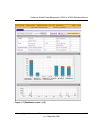
When you start up the UTM, the default screen that displays is the Dashboard screen, which lets
you monitor the real-time security scanning status with detected network threats, detected network
traffic, and service statistics for the six supported protocols (HTTP, HTTPS, FTP, SMTP, POP3,
and IMAP). In addition, the screen displays statistics for the most recent five and top five malware
threats detected, IPS signatures matched, instant messaging/peer-to-peer applications blocked,
Web categories blocked, and spam e-mails blocked.
To display the Dashboard screen, select Monitoring > Dashboard from the menu. Because of the
size of the Dashboard screen, it is divided and presented in this manual in three figures
(Figure 11-7 on page 11-15, Figure 11-8 on page 11-17, and Figure 11-9 on page 11-19), each with
its own table that explains the fields.
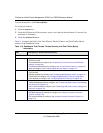
Except for setting the poll interval and clearing the statistics, you cannot configure the fields on the
Dashboard screen. Any changes must be made on other screens.
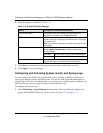
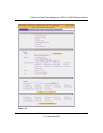
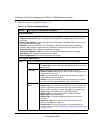
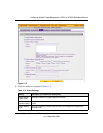
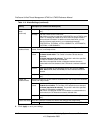
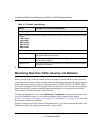
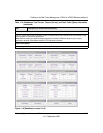
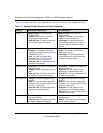
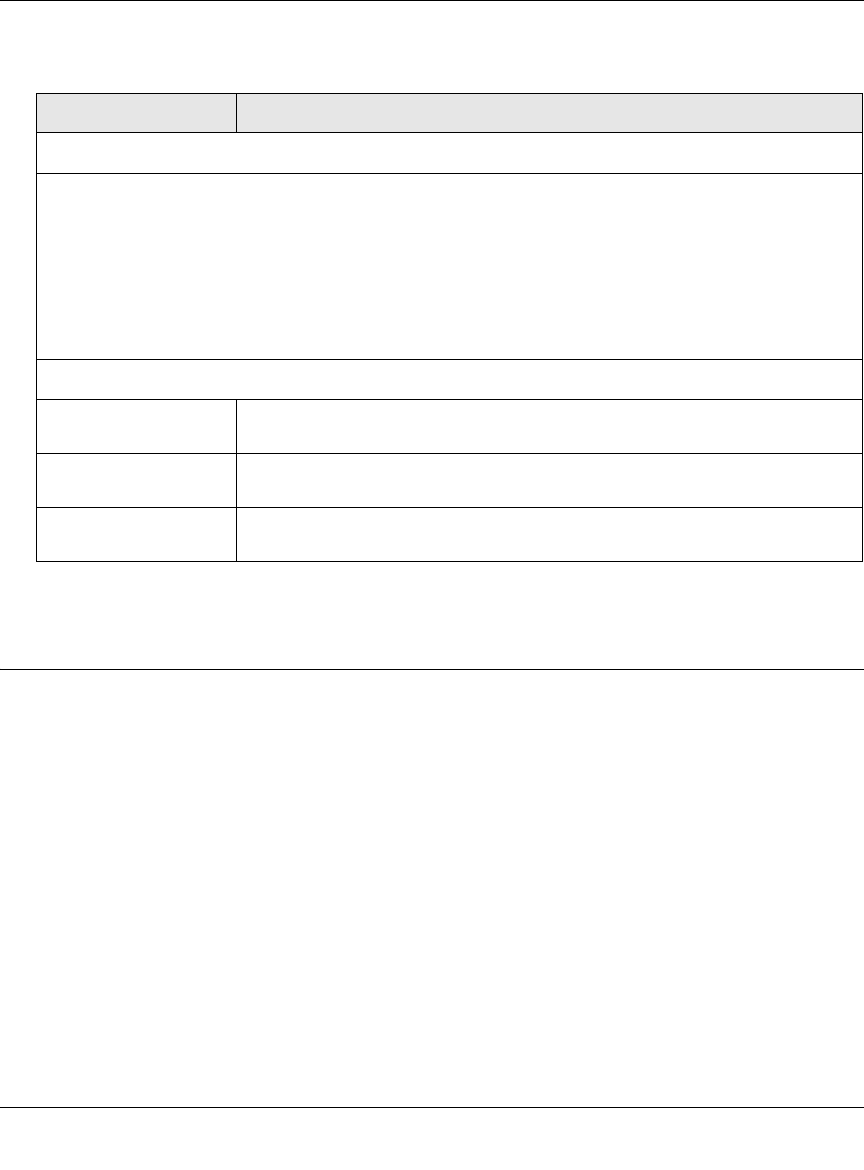
Table 11-5. Firewall Logs Settings
Setting Description (or Subfield and Description)
Routing Logs
From the Accepted Packets and Dropped Packets columns, select checkboxes to specify which traffic
is logged:
• LAN to WAN.
• LAN to DMZ.
• DMZ to WAN.
• WAN to LAN.
• DMZ to LAN.
• WAN to DMZ.
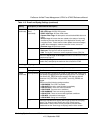
Other Event Logs
Source MAC Filter Select this checkbox to log packets from MAC addresses that match the
source MAC address filter settings.
Session Limit Select this checkbox to log packets that are dropped because the session
limit has been exceeded.
Bandwidth Limit Select this checkbox to log packets that are dropped because the bandwidth
limit has been exceeded.