


ProSecure Unified Threat Management UTM10 or UTM25 Reference Manual
11-20 Monitoring System Access and Performance
v1.0, September 2009
Viewing Status Screens
The UTM provides real-time information in a variety of status screens that are described in the
following sections:
• “Viewing System Status” on this page.
• “Viewing Active VPN Users” on page 11-24.
• “Viewing VPN Tunnel Connection Status” on page 11-24.
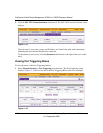
• “Viewing Port Triggering Status” on page 11-26.
• “Viewing the WAN Ports Status” on page 11-27.
• “Viewing Attached Devices and the DHCP Log” on page 11-29.
• “Viewing the DHCP Log” on page 11-31.
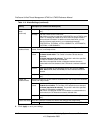
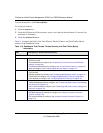
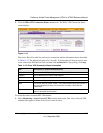
Viewing System Status
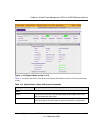
The System Status screen provides real-time information about the following important
components of the UTM:
• CPU, memory, and hard disk status, and the number of active connections per protocol.
• Firmware versions and update information of the UTM, software versions and update
information of the components, license expiration dates for each type of license, and hardware
serial number.
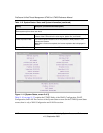
• WAN and LAN port information.
• Interface statistics.
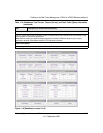
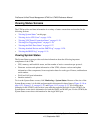
To view the System Status screen, click Monitoring > System Status. Because of the size of the
System Status screen, it is divided and presented in this manual in three figures (Figure 11-10 on
page 11-21, Figure 11-11 on page 11-22, and Figure 11-12 on page 11-23, all of which show
examples for the UTM25), each with its own table that explains the fields. For the UTM25, the
System Status screen shows information for both the WAN1 and WAN2 port. For the UTM10, the
System Status screen shows information for the single WAN port.