


ProSecure Unified Threat Management UTM10 or UTM25 Reference Manual
Monitoring System Access and Performance 11-37
v1.0, September 2009
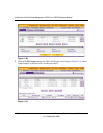
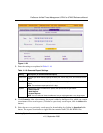
4. Click one of the following action buttons:
• Search. Query the log according to the search criteria that you specified and view the log
through the Web Management Interface, that is, on screen.
• Download. Query the log according to the search criteria that you specified and download
the log to a computer.
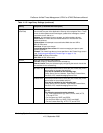
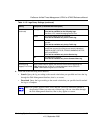
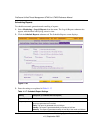
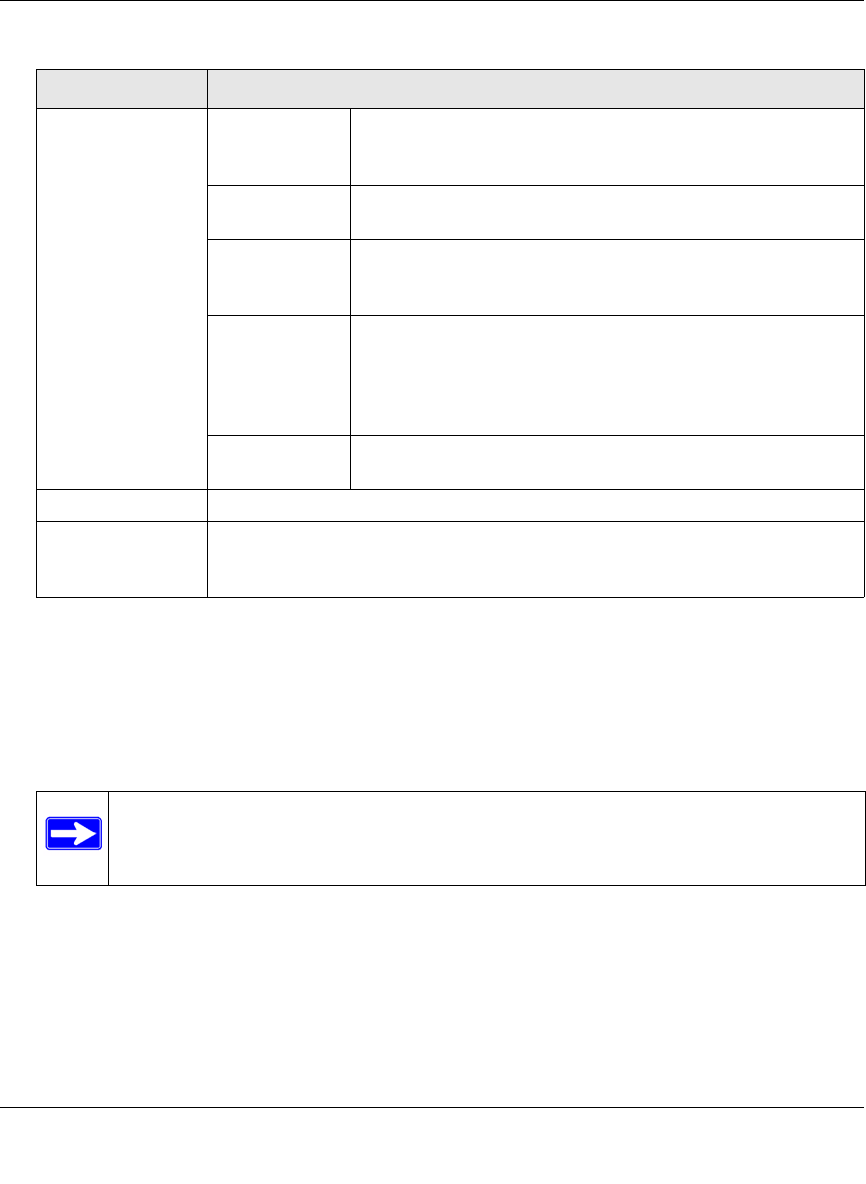
Search Criteria
(continued)
Message The e-mail message text that is queried.
This field is available for the following logs:
Port Scan, IPS, Instant Messaging/Peer to Peer.
Subject The e-mail subject line that is queried.
This field is available only for the Traffic log.
Size The file’s minimum and maximum size (in bytes) that are
queried.
This field is available only for the Traffic log.
Event The type of event that is queried. These events are the same
events that are used for syslog server severity indications:
EMERG, ALERT, CRITICAL, ERROR, WARNING, NOTICE,
INFO, and DEBUG.
This field is available only for the Service log.
URL The URL that is queried.
This field is available only for the Content filters log.
Display The maximum number of pages that is displayed.
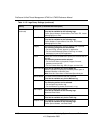
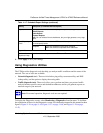
Download Log
(zipped) File Format
Select a radio button to specify the format to download the zipped log file:
• CSV. Download the log file as a comma separated values (CSV) file.
• HTML. Download the log file as an HTML file.
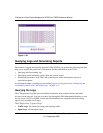
Note: The system, firewall, IPsec VPN, and SSL VPN logs cannot be queried or
downloaded. When you select any of these logs, you can view them through
the Web Management Interface, that is, they appear on screen.
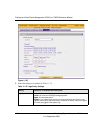
Table 11-15. Logs Query Settings (continued)
Setting Description (or Subfield and Description)