


ProSecure Unified Threat Management UTM10 or UTM25 Reference Manual
Monitoring System Access and Performance 11-33
v1.0, September 2009
• System Logs. The system event logs that you have specified on the Email and Syslog screen
(see “Configuring and Activating System, E-mail, and Syslog Logs” on page 11-6). However,
by default, many more types of events are logged in the system logs.
• Service Logs. All events that are related to the status of scanning and filtering services that are
part of the Application Security main navigation menu. These events include update success
messages, update failed messages, network connection errors, and so on.
• Malware Logs. All intercepted viruses, spyware, and other malware threats.
• Email filter Logs. All e-mails that are blocked because of file extension and keyword
violations.
• Content Filter Logs. All attempts to access blocked Web sites and URLs.
• IPS Logs. All IPS events.
• Portscan Logs. All port scan events.
• Instant Messaging/Peer-to-Peer Logs. All instant messaging and peer-to-peer access
violations.
• Firewall Logs. The firewall logs that you have specified on the Firewall Logs screen (see
“Configuring and Activating Firewall Logs” on page 11-13 on page 11-14).
• IPSEC VPN Logs. All IPsec VPN events.
• SSL VPN Logs. All SSL VPN events.
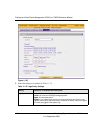
You can query and generate each type of log separately and filter the information based on a
number of criteria. For example, you can filter the malware logs using the following criteria (other
log types have similar filtering criteria):
• Start date/time and end date/time
• Protocols (HTTP, HTTPS, FTP, SMTP, POP3, and IMAP)
•Malware name
• Action
• Client and server IP addresses
• Recipient e-mail address
To query and download logs:
1. Select Monitoring > Logs & Reports from the menu. The Logs & Reports submenu tabs
appear, with the Email and Syslog screen in view.
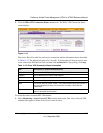
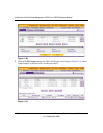
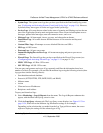
2. Click the Logs Query submenu tab. The Logs Query screen displays (see Figure 11-23 on
page 11-34, which shows the Malware log information settings as an example).
Depending on the selection that you make from the Log Type pull-down menu, the screen
adjusts to display the settings for the selected type of log.