


OPERATION
B-16 B-16
VRTEX
TM
360
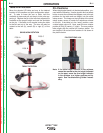
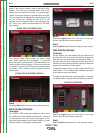
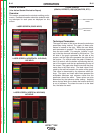
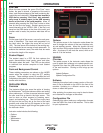
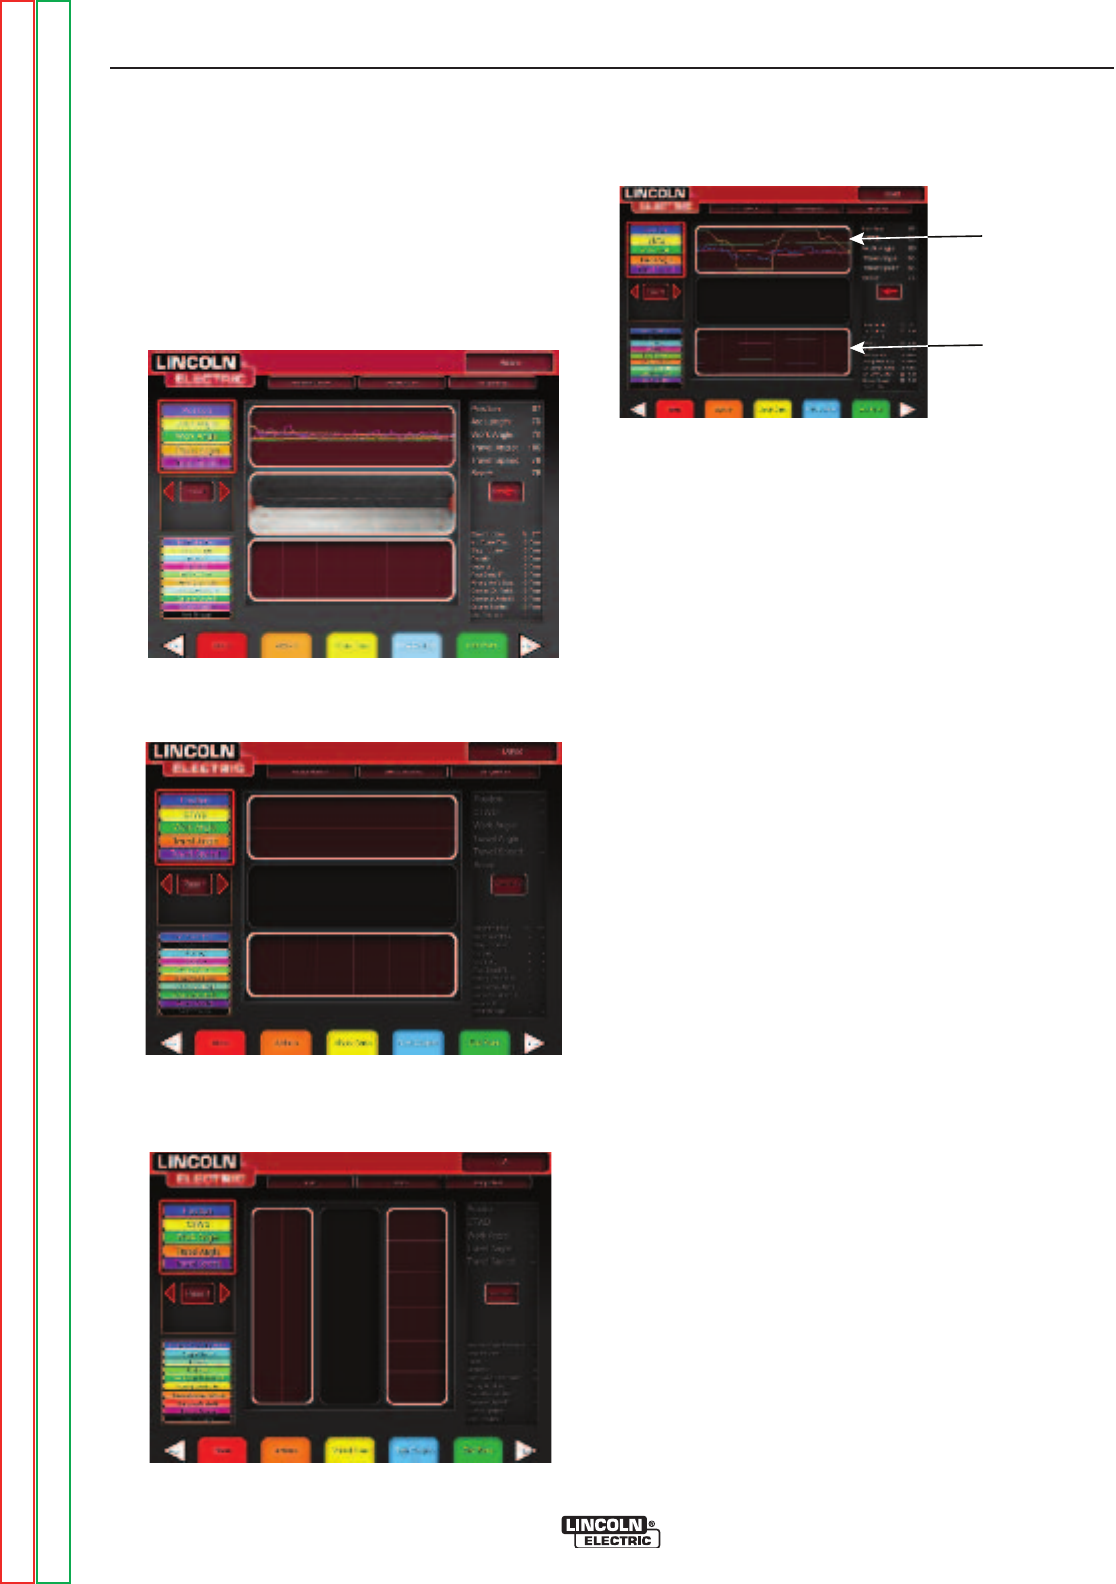
LASER SCREEN (HORIZONTAL WELDING)
NO WELD
LASER SCREEN (VERTICAL WELDING)
NO WELD
LASER SCREEN
(GRAPH, DEFECTS, DISCONTINUITIES, ETC.)
WELD TECHNIQUE
GRAPH
DISCONTINUITY
INDICATOR
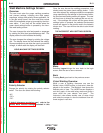
LASER SCREEN
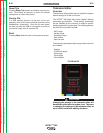
(Live Action Student Evaluation Report)
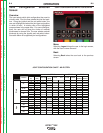
Overview
This screen summarizes the students welding perfor-
mance. Detailed information about the students weld-
ing technique for each pass are displayed on this
screen.
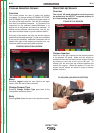
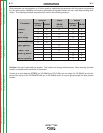
Technique Parameters
The upper left area of the screen shows the technique
parameters being tracked. The graph of these para-
meters is located to the right. When the user welds,
each parameter is graphed. The technique parameter
lines are color coded. For example, “position” is writ-
ten in the blue box and indicated by the blue line. The
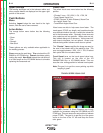
left side of the graph represents the left side of the
coupon, and the right side represents the right side of
the coupon. For vertical welds, the graph is rotated so
that it is vertical, with the bottom representing the bot-
tom of the coupon and the top representing the top of
the coupon. The graph also shows how close the para-
meter was to the ideal value. The ideal value is indi-
cated by the red line located in the center of the graph.
This value is determined by the tolerance editor set-
tings. The upper and lower white lines represent the
acceptable maximum and minimum values that the
parameter should be within. These values are also
determined by the tolerance editor setting. Anything
above the top white line or below the bottom white line
is out of tolerance. The closer the user is to the ideal
line, the better the weld.
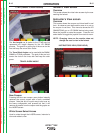
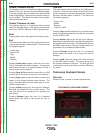
LASER SCREEN (GOOD WELD)
Return to Section TOC Return to Section TOC Return to Section TOC Return to Section TOC
Return to Master TOC Return to Master TOC Return to Master TOC Return to Master TOC