


170 Chapter 2
Performance Verification Tests
22. Frequency Response: Agilent E4401B and E4411B
10.On the analyzer, press Peak Search (or Search).
11.Adjust the function generator amplitude until the marker delta (
∆
Mkr1) amplitude reads 0 dB
±0.05 dB.
12.Record the DVM reading in Table 2-42 as the DVM amplitude
reading.
13.Repeat step 8 through step 12 for each frequency in Table 2-42.
14.For each of the frequencies in Table 2-42, subtract the DVM
amplitude from the DVM Amplitude at 100 kHz recorded in step 6.
Record the result as the Response Relative to 100 kHz in Table 2-42.
15.From Table 2-41, note the Flatness Relative to 50 MHz for the
100 kHz frequency. Record this below as the 100 kHz error relative
to 50 MHz:
100 kHz Error Relative to 50 MHz __________ dB
16.Add the 100 kHz error relative to 50 MHz that was recorded in
step 15 above to each of the Response Relative to 100 kHz entries in
Table 2-42. Record the results as the Response Relative to 50 MHz in
Table 2-42.
Test Results
1. Enter the most positive number from the Flatness Relative to
50 MHz column of Table 2-41:
____________ dB
2. Enter the most positive number from the Response Relative to
50 MHz column of Table 2-42:
____________ dB
75
Ω inputs, Option 1DP: The frequency range below 100 kHz was not
tested; no entry from Table 2-42 is necessary.
3. Record the more positive of numbers from step 1 and step 2 in
Table 2-43 as the Maximum Response for Band 0.
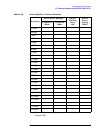
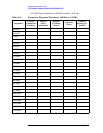
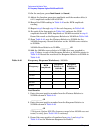
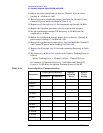
Table 2-42 Frequency Response Worksheet,
≤100 kHz
Frequency
DVM
Amplitude
Response
Relative to
100 kHz
Response
Relative to
50 MHz
100 kHz 0 dB (Ref)
75 kHz
50 kHz
20 kHz
9 kHz