


630 Chapter 3
Performance Verification Test Records
Agilent E4411B Performance Verification Test Record
Minimum Response –1.0 dB (2)________ ±0.11 dB
Peak-to-Peak Response (3)________ 2.0 dB
±0.11 dB
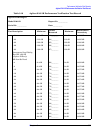
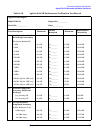
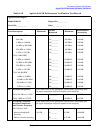
28. Other Input-Related
Spurious Responses
Input Frequency
542.8 MHz (1)________ –65 dBc
±.889 dB
510.7 MHz (2)________ –65 dBc
±.889 dB
1310.7 MHz (3)________ –45 dBc
±.889 dB
30. Spurious Responses Note: Enter the results in the appropriate lines below based upon the
input impedance of the analyzer. Test Record Entry 2 does not apply
to Agilent E4411B.
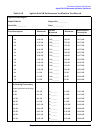
50 MHz TOI, 50
Ω 7.5 dBm (1)________ ±0.93 dB
50 MHz TOI, 75
Ω 56.25 dBmV (1)________ ±0.93 dB
40 MHz SHI, 50
Ω 35 dBm (3)________ ±.050 dB
40 MHz SHI, 75
Ω 83.75 dBmV (3)________ ±.050 dB
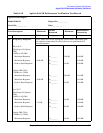
33. Gain Compression Note: Test Record Entry 2 does not apply to Agilent E4411B.
Test Frequency
53 MHz (1)________ 1.0 dB
±0.123 dB
1403 MHz (3)________ 1.0 dB ±0.123 dB
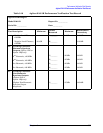
35. Displayed Average
Noise Level
Note: Enter data in the appropriate section below depending upon
the input impedance and serial number of the analyzer.
50
Ω, 1 kHz RBW
400 kHz (1)________ –115 dBm ±1.23 dB
1 MHz to 10 MHz (2)________ –115 dBm
±1.23 dB
10 MHz to 500 MHz (3)________ –119 dBm
±1.23 dB
500 MHz to 1 GHz (4)________ –117 dBm ±1.23 dB
1 GHz to 1.5 GHz (5)________ –113 dBm
±1.23 dB
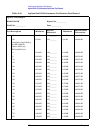
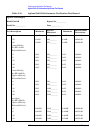
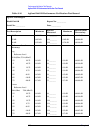
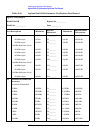
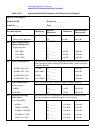
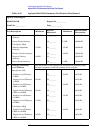
Table 3-16 Agilent E4411B Performance Verification Test Record
Agilent Technologies
Model E4411B Report No. ___________
Serial No. ___________ Date ___________
Test Description Minimum
Results
Measured
Maximum
Measurement
Uncertainty