


Chapter 2 281
Performance Verification Tests
32. Spurious Responses: Agilent E4404B, E4405B, E4407B, and E4408B
11.Subtract the power meter reading at 600 MHz from the power meter
reading at 300 MHz. Record this difference as the 300 MHz
Frequency Response Error in Table 2-76. For example, if the power
meter reading at 600 MHz is –6.45 dBm and the power meter
reading at 300 MHz is –7.05 dBm, the 300 MHz Frequency Response
Error would be –0.60 dB:
Measuring 900 MHz Frequency Response Error
12.On the synthesized sweeper, press the following:
CW, 900 MHz
POWER LEVEL, 0dBm
13.On the analyzer, press FREQUENCY, 900 MHz.
14.Enter the power sensor 1 GHz calibration factor into the power
meter.
15.On the analyzer, press
Marker, Off
Peak Search
(or Search).
Marker, Delta
16.Record the power meter reading in Table 2-76 as the 900 MHz power
meter reading.
17.On the synthesized sweeper, press
CW, 1.8 GHz.
18.On the analyzer, press the following:
FREQUENCY, 1.8 GHz
Peak Search
(or Search)
AMPLITUDE
19.On the analyzer, press Peak Search (or Search).
20.Adjust the synthesized sweeper power level until the marker delta
(
∆ Mkr1) amplitude reads 0 dB ±0.1 dB.
21.Enter the power sensor 2 GHz calibration factor into the power
meter.
22.Record the power meter reading in Table 2-76 as the 1.8 GHz power
meter reading.
23.On the analyzer, press
Marker, Off.
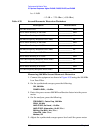
24.Subtract the power meter reading at 1.8 GHz from the power meter
reading at 900 MHz. Record this difference as the 900 MHz
Frequency Response Error in Table 2-76. For example, if the power
meter reading at 1.8 GHz is –6.35 dBm and the power meter reading
0.60 dB 7.05 dBm 6.45 dBm–()––=–