


292 Chapter 2
Performance Verification Tests
33. Gain Compression: Agilent E4401B, E4402B, E4403B, and E4411B
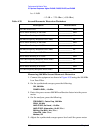
7. Record the actual synthesized sweeper power level setting in
Table 2-77 for each frequency indicated.
8. Repeat step 3 through step 7 for each of the settings listed in
Table 2-77. The test at 50 MHz with a span of 1 kHz, is only for the
E4401B and E4402B with Option 1DR.
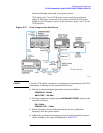
9. Disconnect the power sensor from the directional bridge and connect
the directional bridge to the input of the analyzer using an adapter.
Do not use a cable.
75
Ω Input only: Use a 75 Ω adapter, Type-N (m) to BNC (m) and a
mechanical adapter, Type-N (m) 50
Ω to Type-N (f) 75 Ω
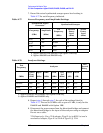
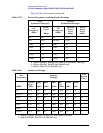
Table 2-77 Source Frequency and Amplitude Settings
Synthesized Signal
Generator
Synthesized Sweeper
Frequency
(GHz)
Amplitude
(dBm)
CW
Frequency
(MHz)
Desired
Power
Level
(dBm)
Actual
Power
Level
(dBm)
0.05
−40 53 0.0
0.05
a
−40 50.004 0.0
1.40
−40 1403 0.0
2.50
b
−40
b
2503
b
0.0
b
a. Agilent E4401B and E4402B with Option 1DR only.
b. Agilent E4402B and E4403B only.
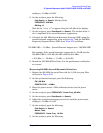
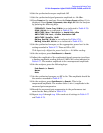
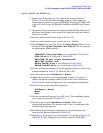
Table 2-78 Analyzer Settings
Test
Frequency
Analyzer
Test
Record
Entry
(MHz)
Center
Freq
(GHz)
Span
(kHz)
RBW
(kHz)
VBW
(kHz)
Ref
Lvl
(dBm)
Scale
(dB)
Atten
(dB)
53 0.05 150 30 0.300
−10.0 10 0.0 1)
50.004
a
0.05
a
1.0
a
0.030
a
0.030
a
−10.0
a
10
a
0.0
a
2)
1403 1.40 150 30 0.300
−10.0 10 0.0 3)
2503
b
2.50
b
150
b
30
b
0.300
b
−10.0
b
10
b
0.0
b
4)
a. Agilent E4401B and E4402B with Option 1DR only.
b. Agilent E4402B and E4403B only.