


212 Chapter 2
Performance Verification Tests
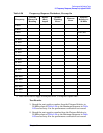
24. Frequency Response, Agilent E4404B, E4405B, E4407B, and E4408B
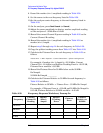
14.Note the most negative number from the Flatness Relative to
50 MHz (ac) column of Table 2-52 for frequencies between 6.7 GHz
and 13.2 GHz. Record this number in Table 2-56 as the Minimum
Response for Band 2.
15.For Band 2 in Table 2-56, subtract the Minimum Response value
from the Maximum Response value and record the result in the
Peak-to-Peak Response column.
16.Note the most positive number from the Flatness Relative to 50 MHz
(ac) column of Table 2-52 for frequencies between 13.2 GHz and
26.5 GHz. Record this number in Table 2-56 as the Maximum
Response for Band 3.
17.Note the most negative number from the Flatness Relative to
50 MHz (ac) column of Table 2-52 for frequencies between 13.2 GHz
and 26.5 GHz. Record this number in Table 2-56 as the Minimum
Response for Band 3.
18.For Band 3 in Table 2-56, subtract the Minimum Response value
from the Maximum Response value and record the result in the
Peak-to-Peak Response column.
19.Transfer the values entered in Table 2-56 to the test record in this
guide.
20.The frequency response test for Agilent E4407B analyzers with
Option UKB is now complete.
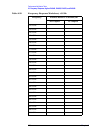
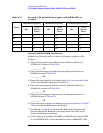
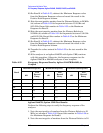
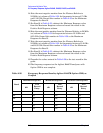
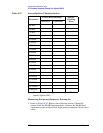
Table 2-56 Frequency Response Results, Agilent E4407B Option UKB, ac
Coupled
Band
Maximum Response Minimum Response Peak-to-Peak Response
dB
Test
Record
Entry
dB
Test
Record
Entry
dB
Test
Record
Entry
0 19) 20) 21)
0A 22) 23) 24)
0B 25) 26) 27)
1 28) 29) 30)
2 31) 32) 33)
3 34) 35) 36)