


Chapter 2 91
Performance Verification Tests
12. Display Scale Fidelity
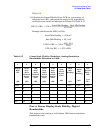
Example Calculation for ILFE at –20 dB from REFLVL setting:
2. Record the result in the performance verification test record as
indicated in Column 9 of Table 2-13.
Part 2: Log Display Scale Fidelity, Digital Bandwidths
This section is for analyzers with Option 1DR (narrow resolution
bandwidths) only.
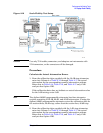
Setup for Log Scale Measurement
1. Set the following parameters on the analyzer:
SPAN, 150 Hz
BW/Avg, 10 Hz
(ESA-E Series only)
BW/Avg, 100 Hz (ESA-L Series only)
BW/Avg, Video BW, 3 Hz
2. Press Peak Search (or Search) on the analyzer.
3. Adjust the amplitude of the synthesized signal generator until the
analyzer marker amplitude reads 0 dBm
±0.1 dB.
75
Ω Input only: Adjust the amplitude of the synthesized signal
generator until the analyzer marker amplitude reads
48.75 dBmV
±0.1 dB.
4. Set the 1 dB and the 10 dB step attenuators to 0 dB.
NOTE Do not adjust the synthesized signal generator amplitude after the
reference is established.
5. On the analyzer, press
Marker, Delta.
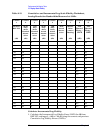
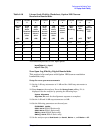
Measure the Cumulative Log Fidelity
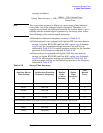
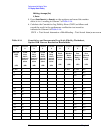
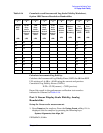
1. Perform step 2 to step 4 for each measurement value in
Table 2-14.
2. Set the 1 dB and 10 dB step attenuators as indicated in Table 2-14
for the various dB from REF LVL settings.
For settings of –84 dB and lower, press the following keys:
ILFE CLFE(current) CLFE(previous)–=
Previous CLFE 16 dB from REF LVL–()0.07 dB–=
Current CLFE 20 dB from REF LVL–()0.02 dB=
ILFE 20– dB()0.02 dB 0.07 dB–()0.09 dB=–=