


Chapter 2 269
Performance Verification Tests
31. Spurious Responses: Agilent E4402B and E4403B
6. Record the power meter reading at 300 MHz in Table 2-73.
7. Set the synthesized sweeper CW to 600 MHz.
8. On the analyzer, press FREQUENCY, 600 MHz, then Peak Search (or
Search).
9. Adjust the synthesized sweeper power level until the marker delta (
∆
Mkr1) amplitude reads 0 dB
±0.10 dB.
10.Enter the power sensor 600 MHz calibration factor into the power
meter.
11.Record the power meter reading at 600 MHz in Table 2-73.
12.Subtract the power meter reading at 600 MHz from the power meter
reading at 300 MHz. Record this difference as the 300 MHz
Frequency Response Error in Table 2-73. For example, if the power
meter reading at 600 MHz is –6.45 dBm and the power meter
reading at 300 MHz is –7.05 dBm, the 300 MHz Frequency Response
Error would be –0.60 dB:
Measuring 900 MHz Frequency Response Error
13.On the synthesized sweeper, press the following:
CW, 900 MHz
POWER LEVEL, 0dBm
14.On the analyzer, press FREQUENCY, Center Freq, 900 MHz.
15.Enter the power sensor 1 GHz calibration factor into the power
meter.
16.On the analyzer, press
Marker, Off
Peak Search
(or Search).
Marker, Delta
0.60 dB 7.05 dBm 6.45 dBm–()––=–
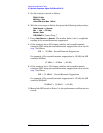
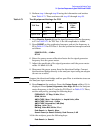
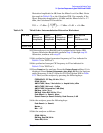
Table 2-73 Second Harmonic Distortion Worksheet
Description Measurement
Power Meter Reading at 300 MHz ________________ dBm
Power Meter Reading at 600 MHz ________________ dBm
300 MHz Frequency Response Error (FRE) ________________ dB
Power Meter Reading at 900 MHz ________________ dBm
Power Meter Reading at 1800 MHz ________________ dBm
900 MHz Frequency Response Error (FRE) ________________ dB