


184 Chapter 2
Performance Verification Tests
23. Frequency Response, Agilent E4402B and E4403B
Test Results
Perform the following steps to verify the frequency response of the
analyzer.
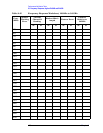
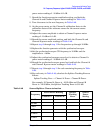
1. Enter the most positive number from the Flatness Relative to
50 MHz (dc) column of Table 2-45:
____________ dB
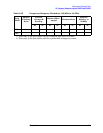
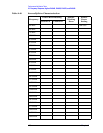
2. Enter the most positive number from the Response Relative to
50 MHz column of Table 2-46:
____________ dB
3. Record the most positive of numbers from step 1 and step 2 into
Table 2-47 as the Maximum Response for Band 0.
4. Enter the most negative number from the Flatness Relative to
50 MHz (dc) column of Table 2-45:
____________ dB
5. Enter the most negative number from the Response Relative to
50 MHz column of Table 2-46:
____________ dB
6. Record the most negative of numbers from step 4 and step 5 into
Table 2-47 as the Minimum Response for Band 0.
7. For Band 0 in Table 2-47, subtract the Minimum Response value
from the Maximum Response value and record the result in the
Peak-to-Peak Response column.
8. If the analyzer is an Agilent E4403B or an E4402B with a serial
number less than US39441006 then transfer the values in Table
2-47 into the test record in this guide. The frequency response test is
complete for those instruments only.
9. If the analyzer has Option UKB then perform step 18 through step
27. Otherwise, perform step 10 through step 16.
10.Note the most positive number from the Flatness Relative to 50 MHz
(dc) column of Table 2-45 for frequencies between 800 MHz and
1.0 GHz. Record this number in Table 2-47 as the Maximum
Response for Band 0A.
11.Note the most negative number from the Flatness Relative to
50 MHz (dc) column of Table 2-45 for frequencies between 800 MHz
and 1.0 GHz. Record this number in Table 2-47 as the Minimum
Response for Band 0A.
12.For Band 0A in Table 2-47, subtract the Minimum Response value
from the Maximum Response value and record the result in the
Peak-to-Peak Response column.