Chapter 9 Monitor
ZyWALL USG 50 User’s Guide
170
•Use the Anti-X Statistics > Anti-Virus screen (see Section 9.13 on page 194)
to start or stop data collection and view virus statistics.
•Use the Anti-X Statistics > IDP screen (Section 9.14 on page 196) to start or
stop data collection and view IDP statistics.
•Use the Anti-X Statistics > Content Filter screen (Section 9.15 on page 198)
to start or stop data collection and view content filter statistics.
•Use the Anti-X Statistics > Content Filter > Cache screen (Section 9.16 on
page 200) to view and configure your ZyWALL’s URL caching.
•Use the Anti-X Statistics > Anti-Spam screen (Section 9.17 on page 203) to
start or stop data collection and view spam statistics.
•Use the Anti-X Statistics > Anti-Spam > Status screen (Section 9.18 on
page 205) to see how many mail sessions the ZyWALL is currently checking and
DNSBL statistics.
•Use the Log (Section 9.19 on page 206) to view the ZyWALL’s current log
messages. You can change the way the log is displayed, you can e-mail the log,
and you can also clear the log in this screen.
9.2 The Port Statistics Screen
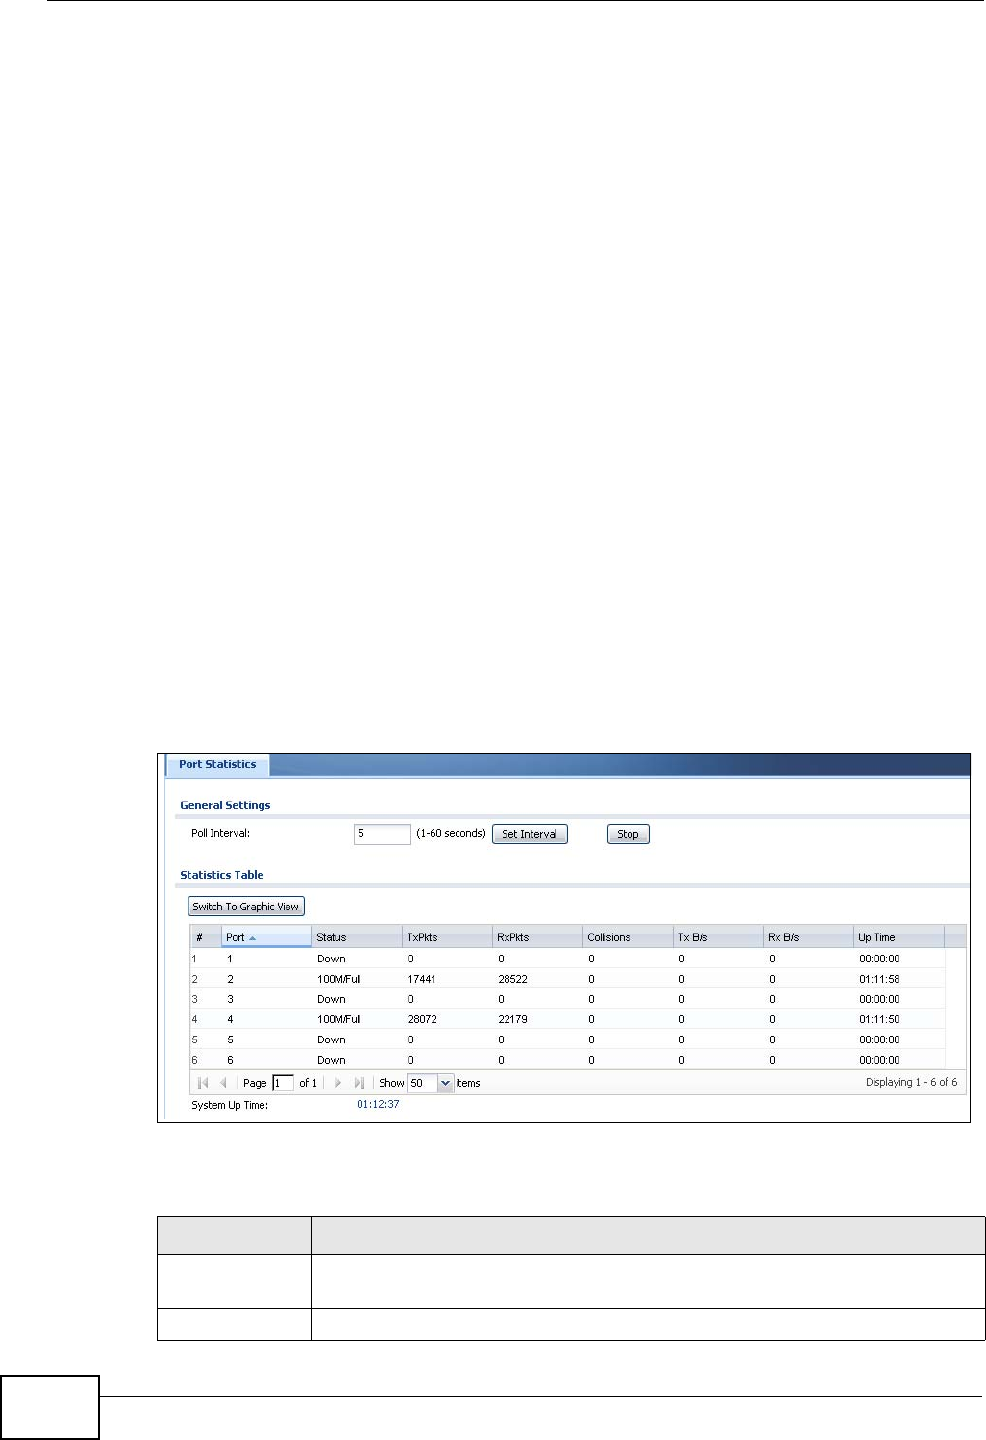
Use this screen to look at packet statistics for each Gigabit Ethernet port. To
access this screen, click Monitor > System Status > Port Statistics.
Figure 121 Monitor > System Status > Port Statistics
The following table describes the labels in this screen.
Table 26 Monitor > System Status > Port Statistics
LABEL DESCRIPTION
Poll Interval Enter how often you want this window to be updated automatically, and
click Set Interval.
Set Interval Click this to set the Poll Interval the screen uses.
