ProWORX 32 Utilities
230
372 SPU 780 01EMAN May 2002
MBP Stat
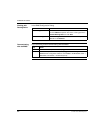
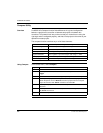
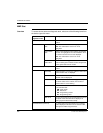
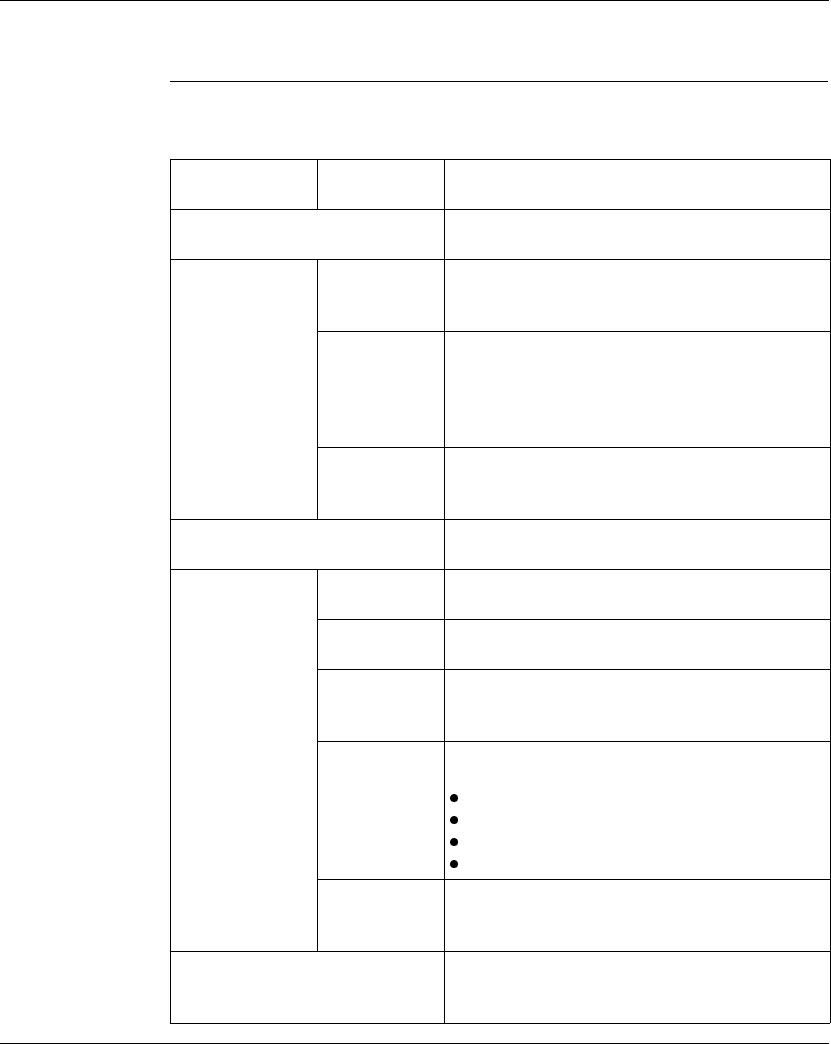
Overview To access device status and diagnostic tools, select one of the following items from
the device right-click menu:
Status and
Diagnostic Tools
Tool Tabs Description
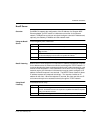
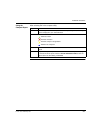
Bus Status (CTRL+B) Used to obtain network status of nodes on the
network.
Active station
table
Active nodes on the network are highlighted.
Note: The node that the cursor is on is not
highlighted.
Token station
table
Nodes on the network that are receiving and passing
the token are highlighted. The Token Rotation Time
and Token Pass Counter are also displayed.
Note: The node that the cursor is on is not
highlighted.
Global data
station table
Nodes that are sending global data to the selected
node are flashing if the selected node is configured to
receive global data from the nodes.
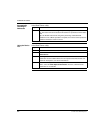
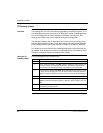
Network Statistics (CTRL+N) Obtain statistics for the node on which the cursor is
located.
Personality Node information, such as type, address, version and
communication state, is displayed.
Error counter Communication information and errors for the
selected node are displayed.
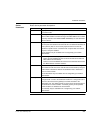
Receive buffers When the node selected is receiving specific input
from other nodes on the network, the number of
receive buffers in use is flashing.
Transactions The number of data transactions for the 8 data paths
of the selected node:
DM - Data master
DS - Data slave
PM - Programming master
PS - Programming slave
Work-to-do The type of programming and/or data activity for the 8
data paths of the selected node is displayed. A
flashing square indicates data activity.
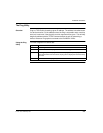
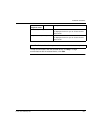
Read Global Data (CTRL+G) The global data being transmitted for the selected
node is displayed. The data can be viewed in HEX,
DEC signed or DEC unsigned format.


