Monitor System Access and Performance
523
ProSecure Unified Threat Management (UTM) Appliance
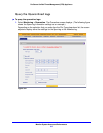
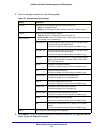
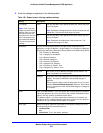
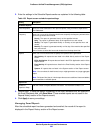
2. Enter the settings as explained in the following table:
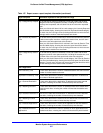
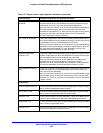
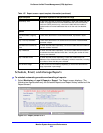
Table 136. Report screen: filtering options settings
Setting Description
Time Range
Note: Even if you click
Apply to save the filtering
options, when you leave
the Report screen and
then return to it, the From
and To drop-down lists
are reset to their defaults.
You cannot save these
settings.
From From the drop-down lists, specify the start year, month, day, and
hour for the report.
Note: By default, the beginning time is 24 hours earlier than the
ending time. The maximum time range is 31 days.
To From the drop-down lists, specify the end year, month, day, and
hour for the report.
Note: By default, the ending time is the current hour. The
maximum time range is 31 days.
Destination You can narrow down the reports to a single domain (wildcards are not
applicable), a single IP address, a single category, or a selection of categories.
Specifying a destination affects the following reports in the Web Activity section:
• Top n Domain by Bandwidth
• Top n Category by Bandwidth
• Top n Blocked Domains
• Top n Blocked Categories
• Top n Domains By Request
• Top n Categories By Request
• Top n Domains by Session Time
• Top n Categories by Session Time
Domain Enter a URL or an IP address in the field next to Domain. The
report is restricted to the specified URL.
Category Select one or more web categories from the drop-down list next to
Category. The report is restricted to the selected category or
categories.
When you select Category from the drop-down list, you can also
select the Exclude selected Categories check box, which allows
you to run a report from which the selected category or categories
are excluded.
Count Enter a number between 1 and 10 to specify how many entries are included in
reports that provide a top count, such as the Top n(umber of) Blocked Domain
report or the Top n(umber of) Infected Clients report.
The default number is 10, which means that a maximum of 10 domains are
included in the Top n Blocked Domain report and a maximum of 10 clients are
included in the Top n Infected Clients report, for example.
Chart Type Specify the type of chart that is generated in the report by making one of the
following selections from the drop-down list:
• Horizontal Bar.
• Pie.
• Vertical Bar. This is the default selection.


