Monitor System Access and Performance
534
ProSecure Unified Threat Management (UTM) Appliance
out which applications are using the most bandwidth, which users use the most bandwidth,
how long users are connected, and other information.
To use the real-time traffic diagnostics tool:
1. Locate the Realtime Traffic Diagnostics section on the Diagnostics screen. In the Source
IP Address field, enter the IP address of the source of the traffic stream that you want to
analyze.
2. In the Destination IP Address field, enter the IP address of the destination of the traffic
stream that you want to analyze.
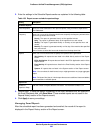
3. From the Select Network drop-down list, select one of the following components:
• A single WAN interface
• The DMZ interface
• The slot in which the xDSL network module is installed (SLOT-1 or SLOT-2) (UTM9S
and UTM25S only)
• A single VLAN
4. Click Start.
5. When you want to stop capturing the traffic flow, click Stop.
6. Select a location to save the captured traffic flow.
The default file name is diagnostics.result.dat. The file is downloaded to the location that
you specify.
7. When the download is complete, browse to the download location that you specified, and
verify that the file has been downloaded successfully.
8. Optional: Send the file to NETGEAR technical support for analysis.
Gather Important Log Information and Generate a
Network Statistics Report
When you request support, NETGEAR technical support might ask you to collect the debug
logs and other information from your UTM.
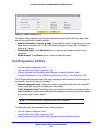
This section discusses the Gather Important Log Information section, Network Statistics
Report section, and Reboot the System section of the Diagnostics screen.


