


Frequency Diagnostics
[SHIFT)
R1,~~b
REF
LVL)
(KM)
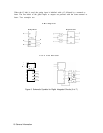
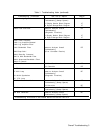
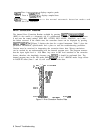
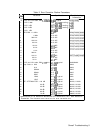
This function displays many of the internal frequency control parameters in the upper
left corner of the CRT display. (See Figure 1.) These parameters are the programmed
values determined by the Al5 Controller. For example, following an
C2-221,
a
@ZiJ
R
MKR~REF
LVL)
(KSR) might display the following values:
1.
2.321 400000
2.
30.000 000
3.
1 17 11
4.
184.545 455
5.
150.000 000
6.
160.300 000
Line 1 is the setting of the YTO Frequency for the selected START frequency.
Line 2 is the setting of the
20/30
SYNTHESIZER for the selected START frequency.
Line
3
contains three different numbers. The first is the band code number. The setting varies
from 0 for center frequencies below 2.5 GHz to 4 for center frequencies above 18.6 GHz. The
second number is the M number of the M/N loop. The third number is the N number of the
M/N Loop.
Line 4 indicates the frequency output of the M/N loop.
Line
5
indicates the frequency to which the PLL2 VCO has been tuned.
Line 6 shows the frequency to which the Controller has programmed the PLL3 VCO.
Lock Indicator Disable
A12TP2
Jumpered to
A12TP3
This function permits the analyzer to sweep at normal sweep rates ignoring any phase lock
flag indications. For example, if a YTO UNLOCK problem exists, the analyzer will sweep
slower since it spends most of its time trying to lock the YTO at center frequency during
retrace. By performing the phase lock inhibit, the analyzer does not waste time trying to lock
the YTO, so the front panel keys and display can be used as in normal operation. Note that
the displayed frequencies will probably not be accurate.
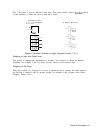
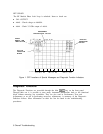
Trace Detection
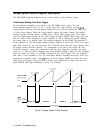
Three different sampling modes are used by the analyzer in converting the video signal; these
are positive peak, negative peak, and sample. Normally the analyzer selects the proper mode
for each measurement, but these can be manually selected to verify proper operation. The
mode selected is indicated on the upper left side of the CRT display when under manual
control. (See Figure 1.) For example, a signal could be expanded to 2 dB/div to eliminate the
noise floor, and then by comparing a positive peak trace measurement, it can be determined
if the gains and offsets of the three modes are properly aligned. All three should appear the
same on a stable, noise-free signal. When in the noise, the positive peak should display the
highest noise peaks, negative peak mode should display the lowest noise levels, and sample
mode should display values between the positive and negative peaks.
[SHIFT)
Trace A
b[MAXHOLD)
(KSb)
displays positive peaks.
Overall Troubleshooting 7