


MODEL 8559A
OPERATION
SECTION Ill
OPERATION
3-1. INTRODUCTION
3
-
2.
This section provides operating information
for the HP
8559A Spectrum Analyzer plug
-
in. It also
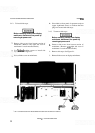
provides a brief description of display mainframe
controls. For a detailed description of the display
mainframe, refer to its manual.
3
-
3.
The HP
8559A Spectrum Analyzer plug
-
in can
be used with either the 180
-
series display mainframes
or the HP
853A Spectrum Analyzer Display main
-
frame.
3-4. DESCRIPTION
3-5.
H
P 8559A Spectrum Analyzer
3
-
6.
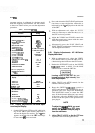
The HP
8559A employs harmonic mixing to
cover a measurement range of 10 MHz to 21
GHz in
six frequency bands. It can display frequency spans
as narrow as
100 kHz, and
as
wide as 9 GHz (the
latter in full span mode). A five
-
digit LED readout
indicates the spectrum analyzer center frequency
with a resolution of 1 MHz. The HP
8559A can be
used to measure signals over an amplitude range of
-
11 1 dBm to
+
30 dBm.
3-7.
HP 853A Spectrum Analyzer Display
3
-
8. The HP 853A Spectrum Analyzer Display is a
large
-
screen, digital storage display mainframe for
use exclusively with the HP
8559A, 8558B, and
8557A Spectrum Analyzer plug
-
ins. Digital memory
provides buffer storage for two independent traces,
both of which can be displayed or blanked as
desired. Digital processing also provides push
-
button
features such as maximum signal hold, digital aver
-
aging, and trace normalization. A conventional ana
-
log display mode can also be selected.
3
-
10. The HP 853A has limited HP
-
IB capabilities.
CRT trace and graticule data is dumped directly to a
listen
-
only HP
-
IB plotter by pressing two front
-
panel
push buttons. Control settings on the spectrum
ana
-
lyzer plug
-
in cannot be monitored via the HP
-
IB;
however, all digital display functions are program
-
mable via a controller, and two lines of annotation
can be displayed on the CRT for labelling purposes
or operator prompting. In addition, controller com
-
mands allow transfer of trace data for analysis or
storage.
3-1 1. CONTROLS, INDICATORS, AND CON
-
NECTORS
3-1
2.
Control Grouping
3
-
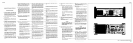
13. The Spectrum Analyzer plug
-
in and Display
mainframe front
-
panel controls fall into three gen
-
eral groups: those that deal with the display, those
that deal with frequency, and those that deal with
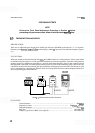
amplitude. These controls are shown in Figure 3
-
1
and accompanied by detailed explanations of their
use.
3
-
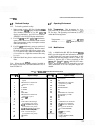
14. Display.
The display group consists of:
SWEEP
TIME/DIV VIDEO FILTER
SWEEP TRIGGER BASELINE CLIPPER
VERT POSN HORIZONTAL
POSI-
TION
VERT GAIN INTENSITY
MANUAL SWEEP FOCUS
HORIZ GAIN (rear TRACE ALIGN
panel of HP
8559A)
3
-
15.
The display group enables the operator to cal
-
ibrate the display and to select a variety of scan and
display conditions. However, when the SWEEP
TIME/DIV Control is placed in the AUTO position,
sweep time is controlled by the RESOLUTION BW,
FREQ
SPAN/DIV, and VIDEO FILTER controls.
3
-
16. Frequency.
The frequency group consists
of:
TUNING
FREQUENCY BAND
GHz
ALT IF
SIG IDENT
RESOLUTION BW
FREQ
SPAN/DIV