


MODEL 8559A PERFORMANCE TESTS
PERFORMANCE TESTS
4.19.
FREQUENCY RESPONSE (Cont'd)
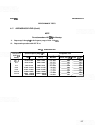
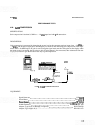
Frequency Response,
3
-
18
GHz
NOTE
For the higher frequency bands, multiple responses may appear on spec
-
trum analyzer display during frequency response measurement. Adjust
INTENSITY control as necessary for optimum display of in
-
band signal
peaks.
17. Select
6
-
9 GHz frequency band on spectrum analyzer. Set sweep oscillator to
CW
and frequency to 7.5
GHz. Use
CW
control to center signal on spectrum analyzer display. Set AF control for 3 GHz and trigger
a sweep. Adjust spectrum analyzer TUNING control clockwise several turns to reposition tuning marker.
Trigger another sweep. Record greatest positive and greatest negative deviation of signal peaks from center
horizontal graticule line (neglect deviations caused by tuning marker).
Maximum divisions
Minimum divisions
18. To calculate frequency response for
6
-
9 GHz frequency band, subtract mean deviation of step 16 from
maximum and minimum values recorded in step 17. Frequency response should not exceed
k
1.0 dB
(
+
1.0 division).
Maximum divisions
(6
-
9 GHz)
Minimum
divisions
(6
-
9 GHz)
19. Select 3
-
9 GHz frequency band on spectrum analyzer. Set sweep oscillator to
CW
and frequency to 6.0
GHz. Use
CW
control to center signal on spectrum analyzer display. Set AF control for
6
GHq and trigger
a sweep. Adjust spectrum analyzer TUNING control to reposition tuning marker. Trigger another sweep.
Record greatest positive and greatest negative deviation of signal peaks from center horizontal graticule
line (neglect deviations caused by tuning marker).
Maximum divisions
Minimum divisions
20. Subtract mean deviation of step 16 from maximum and minimum values recorded in step 19. Frequency
response for 3
-
9 GHz frequency band should not exceed
+
1.5 dB
(
+
1.5 divisions).
Maximum divisions (3
-
9 GHz)
Minimum
divisions
(3
-
9 GHz)