


PERFORMANCE TESTS MODEL 8559A
PERFORMANCE TESTS
-
-
4
-
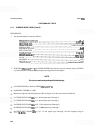
19.
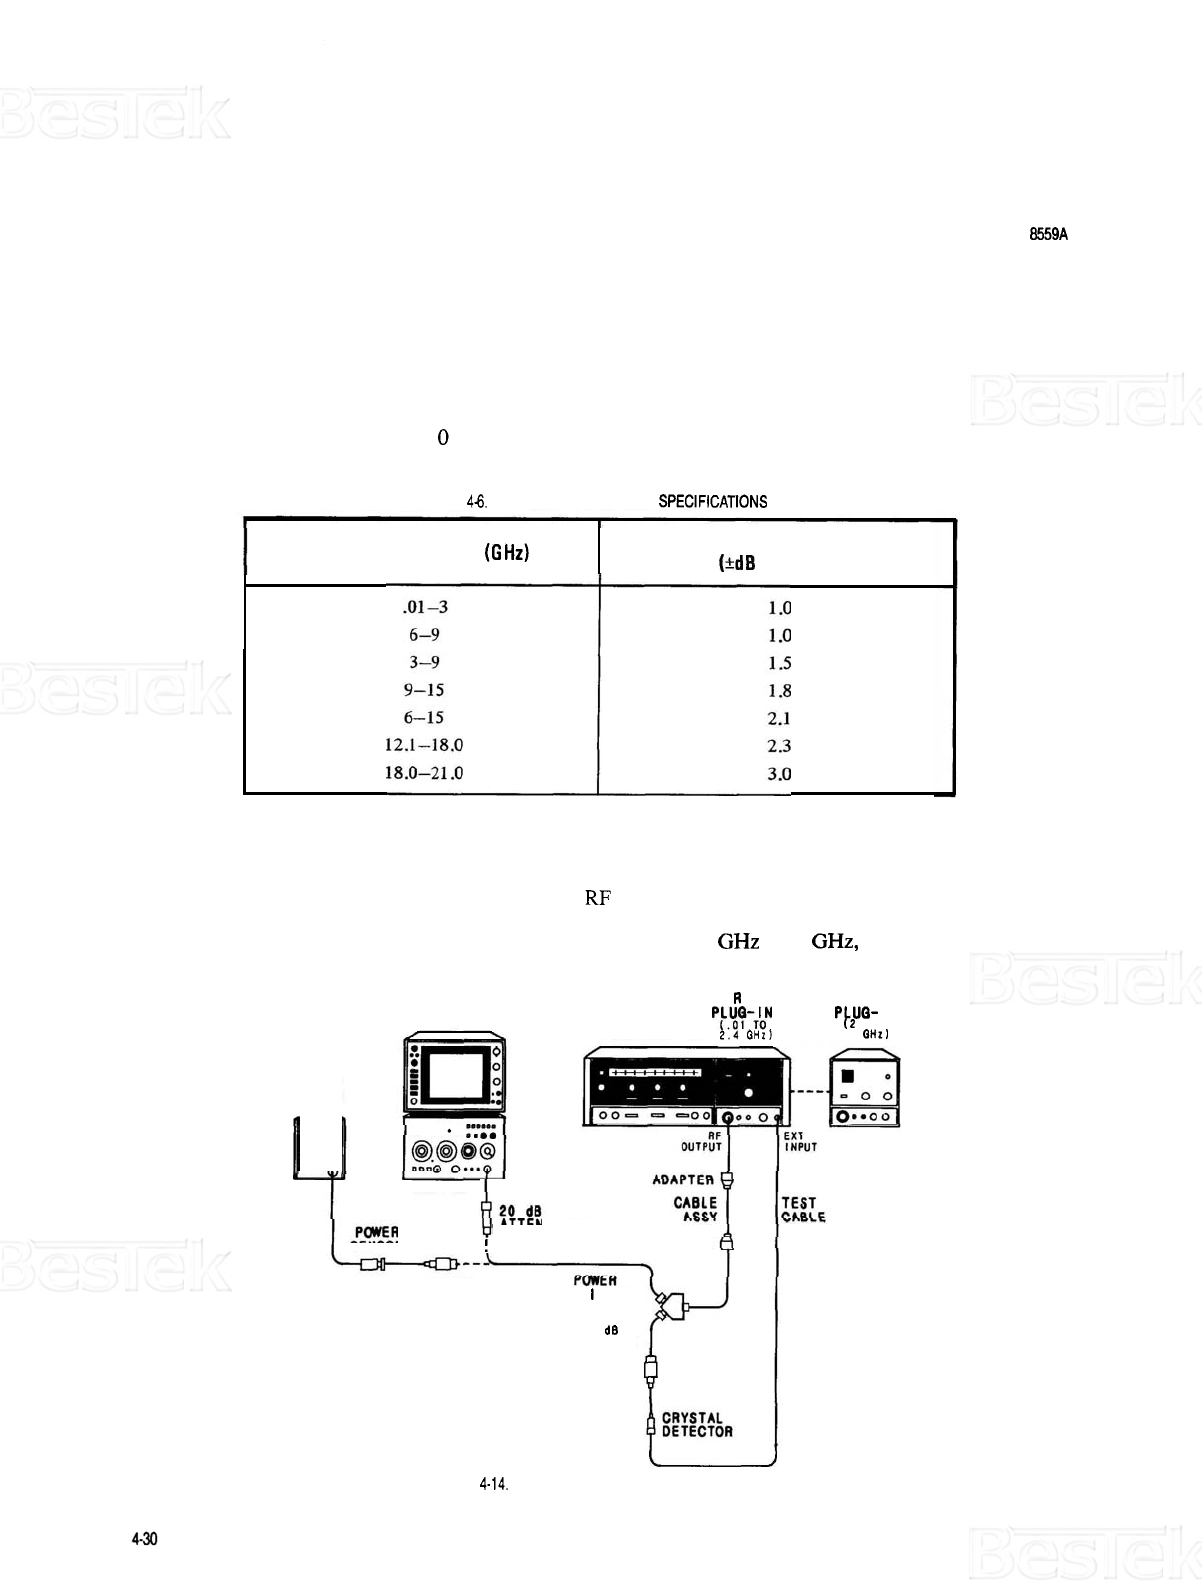
FREQUENCY RESPONSE
SPECIFICATION:
Frequency response measured with
0
or
10
dB of input attenuation includes input attenuator flatness, mixer
flatness, and band
-
to
-
band amplitude variation. Table
4
-
6
shows the frequency response specifications.
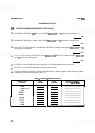
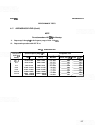
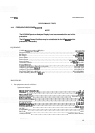
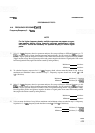
TABLE
48.
FREQUENCY RESPONSE SPEClFiCATiONS
FREQUENCY
BAND
(GHz)
Frequency Response
(*dB
Maximum)
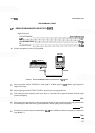
DESCRIPTION:
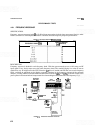
Frequency response is checked in each frequency band. With the spectrum analyzer set to full sweep, an RF
input signal is very slowly swept across the entire frequency band. The resulting display is a series of narrow
signals that vary in height across the CRT. Since the
RF
source is leveled and held flat across each frequency
band, variations in amplitude on the display represent variations in the frequency response of the spectrum
analyzer. Leveling within reasonable limits becomes difficult from
18
GHz to
21
GHz, so the RF output at the
power splitter is characterized and compensated for when making the measurement of this frequency range.
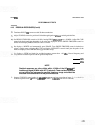
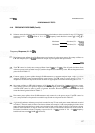
SPECTRUM
ANALYZER
POWER
METER
o
O
o
0
:=*;;
INPUT
50
R
F
WEEP
Pf.!?-/:
OSCILLATOR
2.4QHz)
ATTENUATOR
SENSOR
!
ADAPTER
ADAPTER
SPL
l
TTER
(CONNECTS
Dl
RECTLY
TO
20
dB
ATTENUATORI
ADAPTER
t
RF
PLUO-
IN
(2
TO
21
QHzl
I
FIGURE
4-14.
FREQUENCY RESPONSE TEST SETUP