


PERFORMANCE
TESTS
MODEL 8559A
PERFORMANCE TESTS
4
-
19. FREQUENCY RESPONSE (Cont'd)
NOTE
Use maximum possible ALC
GAIN to avoid leveling errors during swept
measurements.
Do not adjust spectrum analyzer REF LEVEL
FINE control or sweep oscillam
tor POWER LEVEL control during the remaining steps of this performance
test.
14. Adjust spectrum analyzer TUNING control fully counterclockwise to position tuning marker at low end
of selected frequency band. Set sweep oscillator CW control to
2.5
GHz and AF control for 1 GHz sweep.
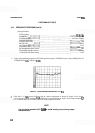
Trigger a sweep, and record greatest positive and greatest negative deviation of signal peaks from center
horizontal graticule line (2
GHz to
3
GHz).
Maximum divisions
Minimum divisions
NOTE
It is normal for the HP
8559A to exhibit baseline lift with an input signal at
approximately
3.0075
GHz(2.9925 with ALT IF selected). Adjust sweep oscil
-
lator sweep range as necessary to avoid baseline lift during frequency
response measurements.
If frequency response appears out of specification near a band edge, use a
frequency counter with sweep oscillator in CW to ensure the frequency in
question is within the specified band.
15.
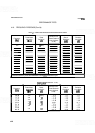
Compare values recorded in steps
8,
11, and 14, and record overall greatest positive and greatest negative
deviation from center horizontal graticule line for entire
.01-
3
GHz frequency band. Frequency response
(deviation from center horizontal graticule line) should not exceed
k
1.0 dB
(
k
1.0 division).
Maximum divisions
(.01-
3
GHz)
Minimum divisions
(.01
-
3 GHz)
16.
Calculate mean deviation for .01-
3
GHz frequency band using maximum and minimum values recorded
in step
15.
(For example, a maximum of
+
0.5 and a minimum of
-
0.7 results in a mean deviation of
-
0.1)
Maximum
+
Minimum
Mean deviation
=
-
-
divisions