


BERT Technical Articles
B-30 GB1400 User Manual
Jitter Tolerance
In general, the noise and imperfect equalization of the transmission system itself introduce much more
jitter than the clock source does. If the jitter, q
i
, of the received data exceeds the receiver’s jitter
tolerance, the receiver will begin making errors. When the BERT is recovering its own clock, the
instrument receiver’s jitter tolerance must be greater than the system receiver’s for all waveforms.
Otherwise, the BERT will report an incorrectly high error rate.
It is impossible to check all waveforms. Fortunately, however, if the BERT receiver has a higher jitter
tolerance for sinusoidal jitter at all jitter frequencies, f
m
, then it has a higher jitter tolerance for all jitter
waveforms.
The maximum data phase jitter,θ
e max
, between the data and the clock that the receiver can tolerate. The
first failure may be the setup time when the decision circuit samples the data with the clock.
Or the clock-recovery circuit may fail to maintain lock if θ
e
is too great. In any case, θ
e max
is generally
between 0.3 and 1.0 UI peak-to-peak. If the system’s θ
e max
is unknown, it can be measured.
The transfer function from θ
i
to θ
e
is:
θ
e
/θ
i
=f
m
/(f
2
m
=f
2
B
)
1/2
(Equation 2)
where f
m
is the frequency of the sinusoidal jitter.
Then the maximum data jitter a receiver can tolerate is θ
i
max
=θ
e max
/θ
e
/θ
i
Below fB, θI max descends at one decade per decade. Above that frequency (where the clock recovery
can’t follow the data jitter), θ
i max
=θ
e max.
For proper operation, the BERT receiver’s jitter tolerance curve must lie above that of the system
receiver.
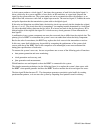
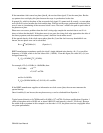
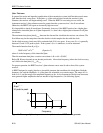
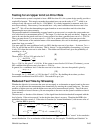
A BERT designed to supply jitter has a sinusoidal generator that modulates the clock phase. Both the
frequency, fm, and the amplitude, A, of the phase are selectable over certain ranges. The range of f
m
is
from f
0
to f
4
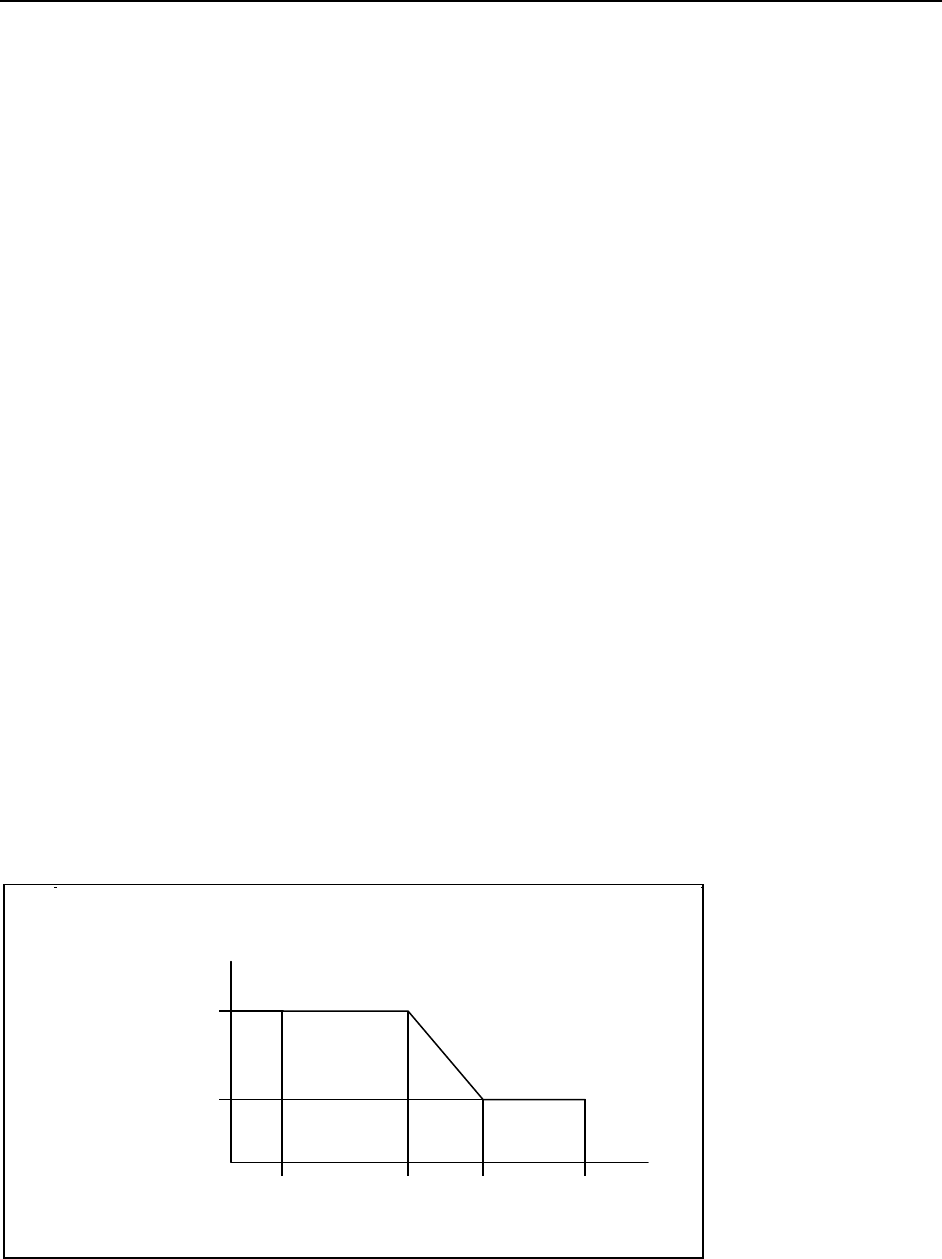
, and the range of the amplitude depends on fm. At low frequencies, the bit-error-rate tester
must generate higher amplitudes than are needed at high frequencies (see following figure).
A1
A2
f1 f2 f3 f4
Frequency
Amplitude
UI peak-to-peak
Figure 5. The range of jitter frequencies and amplitudes that a BERT should generate.