BERT Technical Articles
B-36 GB1400 User Manual
Standard Mathematical Tables published by the Chemical Rubber Co, or use the software product
Mathcad produced by MathSoft.
It is usually convenient to measure signal strength and noise in dB. Let the signal-to-noise ratio in dB be
defined as
SNR = 20 log(S / N
rms
). (12)
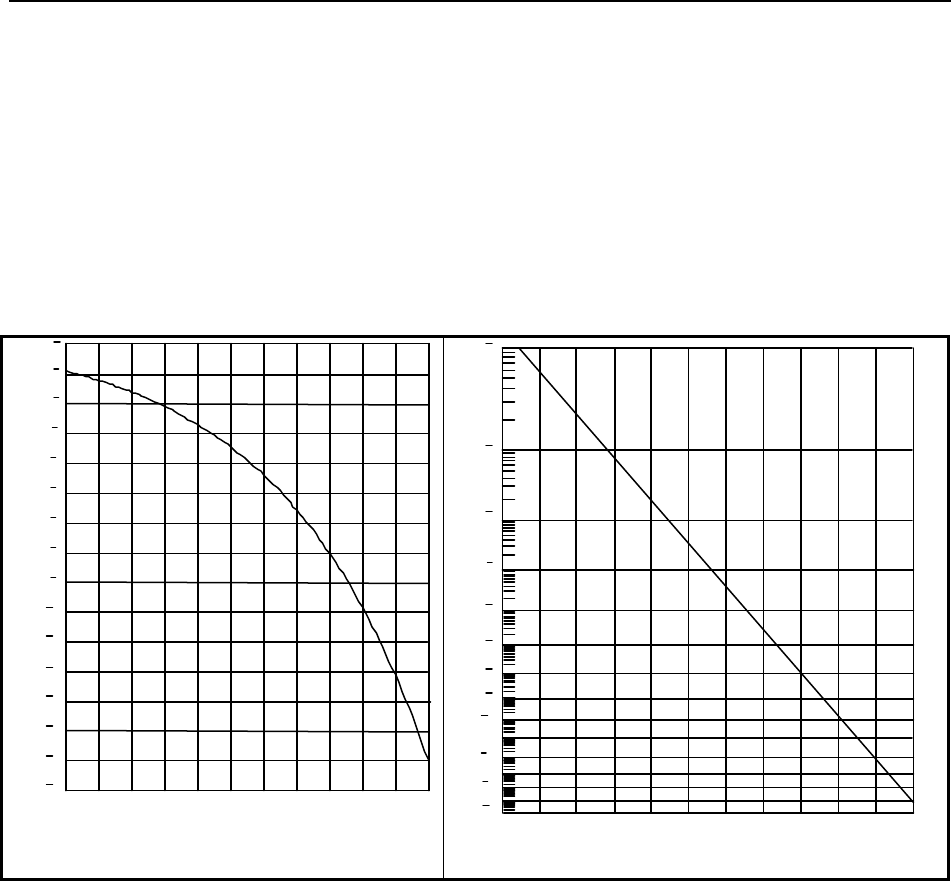
Then with Equation (11) we can find BER as a function of SNR. This is plotted in Figure 4. In Figure 4a
the BER axis is a log scale. In Figure 4b the BER axis has a specially distorted scale so the plot appears
as a straight line. This will help in determining whether noise is Gaussian, and it will help in
extrapolating data. Suppose a system has a SNR of 18 dB. According to Figure 4, the corresponding bit
error ratio is 10
−16
. At a baud of 1 Gbit/s, this would yield an error only once every 4 months on average.
To get an estimate of this error rate in a reasonable time, testing with stress is necessary.
7 8 9 10 11 12 13 14 15 16 17 18
10
16
10
15
10
14
10
13
10
12
10
11
10
10
10
9
10
8
10
7
10
6
10
5
BER
SNR (dB)
10
3
10
4
10
2
10
(a)
10
16
10
14
10
12
10
10
10
9
10
8
10
7
10
6
10
5
BER
SNR (dB)
10
10
3
10
4
18
171615141312
11
10987
(b)
Figure 4. Bit-Error-Rate (BER) is plotted here as a function of the signal-to-noise ratio (SNR),
where SNR is S/N
rms
in decibels (electrical), S is the distance from the signal (1 or 0) to the
decision threshold and N
rms
is the rms value of the Gaussian noise introduced by the first receiver
state (a). In (b), the log scale was distorted, so the plot is a straight line.
The stress that we propose is attenuation of the received signal S. Most of the system noise arises in the
input stage of the data receiver, and the attenuator won't affect this noise. Then if there is no AGC, the
attenuator reduces S. If there is an AGC, S is held constant and the noise increases. In any case, the ratio
of S to N
rms
changes with the attenuation; 6 dB of electrical attenuation decreases the signal-to-noise ratio
by 6 dB. In general, the signal-to-noise ratio with stress is
SNR = SNR
0
– Attenuation, (13)
where SNR
0
is the signal-to-noise ratio without stress (attenuator set to 0 dB).
In order to properly extrapolate data taken with stress, we need to know what a plot of BER versus
Attenuation looks like for a given SNR
0
. Suppose that SNR
0
is 18 dB. Then for Attenuation = 0 the
SNR is also 18 dB, and from Figure 4 we find BER = 10
−16
(see point at Attenuation = 0 in Figure 5).
As the Attenuation is increased to 6 dB, then SNR is reduced to 18 – 6 = 12 dB. According to Figure 4,
this corresponds to BER = 3.5×10
−5
(see point at Attenuation = 6 dB in Figure 5). The complete plot of


