BERT Technical Articles
B-32 GB1400 User Manual
Technical article from 5/95 issue of Electronic Design Magazine
Measure Error Rates Quickly and Accurately
By Dan H. Wolaver, Tektronix, Inc.
Abstract
The accurate measurement of the error rate of a digital communication system requires
that a good number of errors be recorded. We show that if n errors are counted, then the
inaccuracy is about 1/
n
. For example, by recording 400 errors, the inaccuracy is 5%.
But if the error rate is very low, the time to accumulate 400 errors can be hours or days.
The measurement time can be reduced by stressing the system under test to produce a
higher error rate. Special graph paper is provided here to plot the error rate as a function
of stress. From this plot, error rate measurements made under stress can be extrapolated
to low error rates at no stress. Measurement time can also be reduce when the task is to
determine an upper bound on the error rate rather than determine the error rate accurately.
We show that if a system is error-free for a period T, then there is 95% confidence the
error rate is less than 3/T. For example, if there are no errors for 1 hour, then 95% of the
time the system tested has an error rate less than 3 per hour.
Example of Error Rate Measurement
Digital communication systems are required to have very low error rates−−on the order of 1 error in a
billion bits, or a bit error ratio (BER) of 10
–9
or less. When you must measure such low error rates, you
are faced with a tradeoff; either the test will take a long time or the results will not be accurate. An
example will illustrate a typical situation with such a tradeoff.
Suppose the communication system under test has a bit rate of f
b
= 1.544 Mbit/s, and the BER is required
to be less than 10
–9
. This limit corresponds to 1.544 × 10
6
× 10
–9
= 0.001544 errors per second or 5.56
errors per hour. In general, the error rate r is the bit error ratio times the bit rate:
r = BER × f
b
. (1)
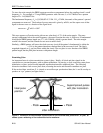
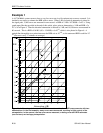
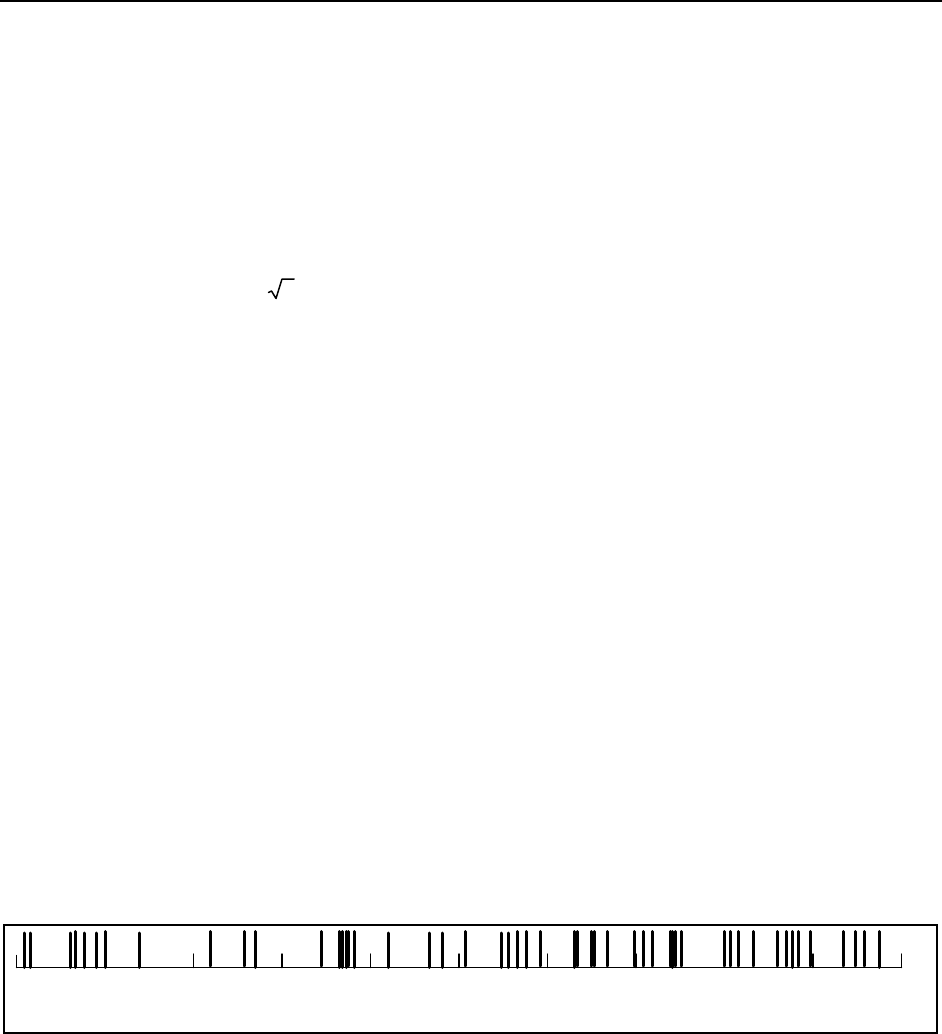
The error rate is measured by using either a parity check or a bit-error-rate test set (BERTS). Suppose the
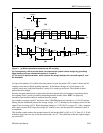
pattern of errors versus time is that shown in Figure 1.
Time in hours
109876542 310
Figure 1. Shown are random occurrences of errors at an average rate of five per hour. The
distribution here is typical of a Poisson random process.
During the first hour there are seven errors. If the test is terminated at that point, the result is r = 7 / hr >
5.56 / hr, and the system fails. But if the test is extended, there is only one error in the second hour for a
total of eight errors in two hours. Then r = 4 / hr < 5.56 / hr, and the system passes. When there is this
much variation in the measured error rate, you don't have much confidence in the accuracy of the
measurement. We will see that greater confidence requires greater time.


