


BERT Technical Articles
GB1400 User Manual B-37
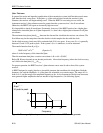
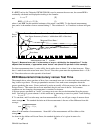
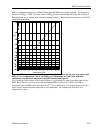
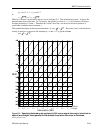
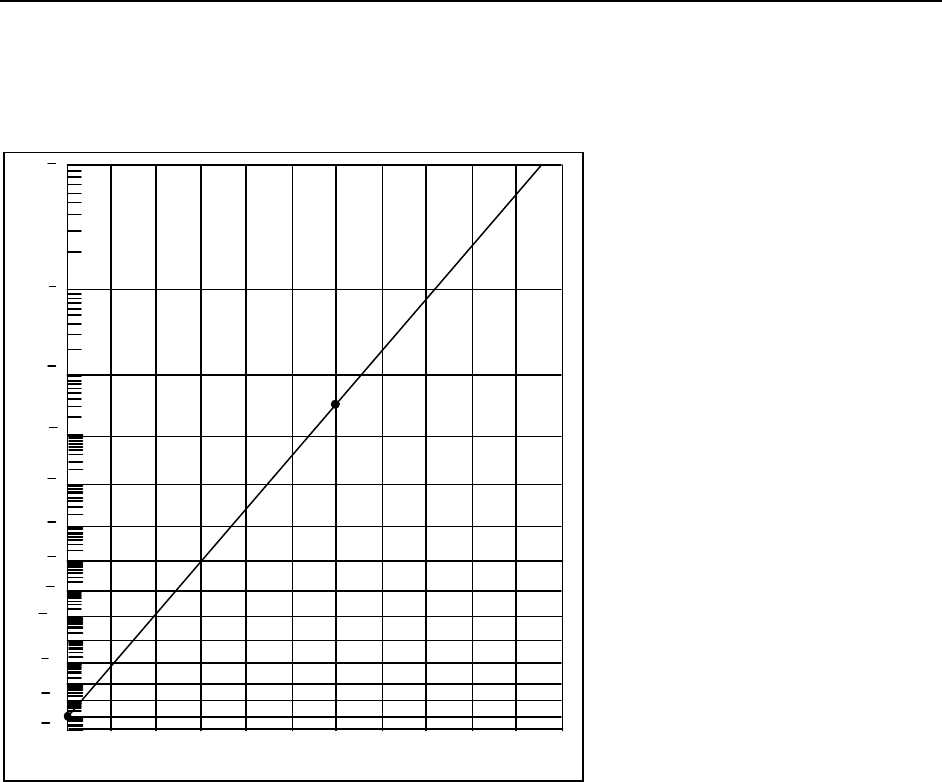
BER vs. Attenuation appears as a straight line because the BER scale is again distorted. The line here is
for the case SNR
0
= 18 dB. For other values of SNR
0
, the plot would fall parallel to the line in Figure 5.
Remember that we are talking about electrical attenuation here; 1 dB of optical attenuation is worth 2 dB
of electrical attenuation.
10
16
10
14
10
12
10
10
10
9
10
8
10
7
10
6
10
5
BER
Attenuation (dB)
10
2
10
3
10
4
11109876543210
Figure 5. BER is plotted as function of electrical-signal attenuation for the case of a system with
BER=10
-6
for no attenuation. That is, the SNR
0
for no attenuation is 18 dB. Then, SNR with
attenuation is 18 dB minus attenuation, and BER follows from Figure 4.
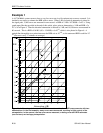
It isn't practical to plot a curve such as that in Figure 5; it would take too long to plot the points for low
BER. But if the noise is known to be Gaussian and the BER is found to be 3.5×10
−5
for 6 dB of
attenuation, then the BER can be inferred to be 10
–16
for no attenuation. It is actually better to plot two
points for two attenuations and extrapolate to zero attenuation. An example will show how this
extrapolation is done.