


BERT Technical Articles
GB1400 User Manual B-43
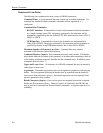
(µ − σ) / T < r' < (µ + σ) / T
or
r
r
T
r
r
r
T
−
<
<
+
/
'
/
.
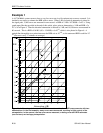
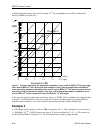
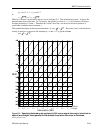
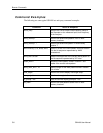
These two "bounds" are shown by the two curves in Figure S-2. The measured error rate r' is seen to lie
between them most of the time. As T increases, the bounds get closer to r = 5 / hr, but there will always
be some deviation of r' from r. Therefore the "actual" error rate r can never be known in practice; it
would take an infinite time to measure r.
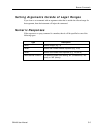
The standard deviation of the error measurement n is
σ µ
= = rT . But since µ and r can't be known
exactly in practice, we must use the estimates µ ≈ n and r ≈ r' to get the estimate
σ
≈
=
n
r
T
'
.
10
16
10
14
10
12
10
10
10
9
10
8
10
7
10
6
10
5
BER
Attenuation (dB)
10
2
10
3
10
4
11109876543210
0 0.5 1 1.5 2 2.5 3 3.5
4
4.5
5 5.5
(elec)
(opt)
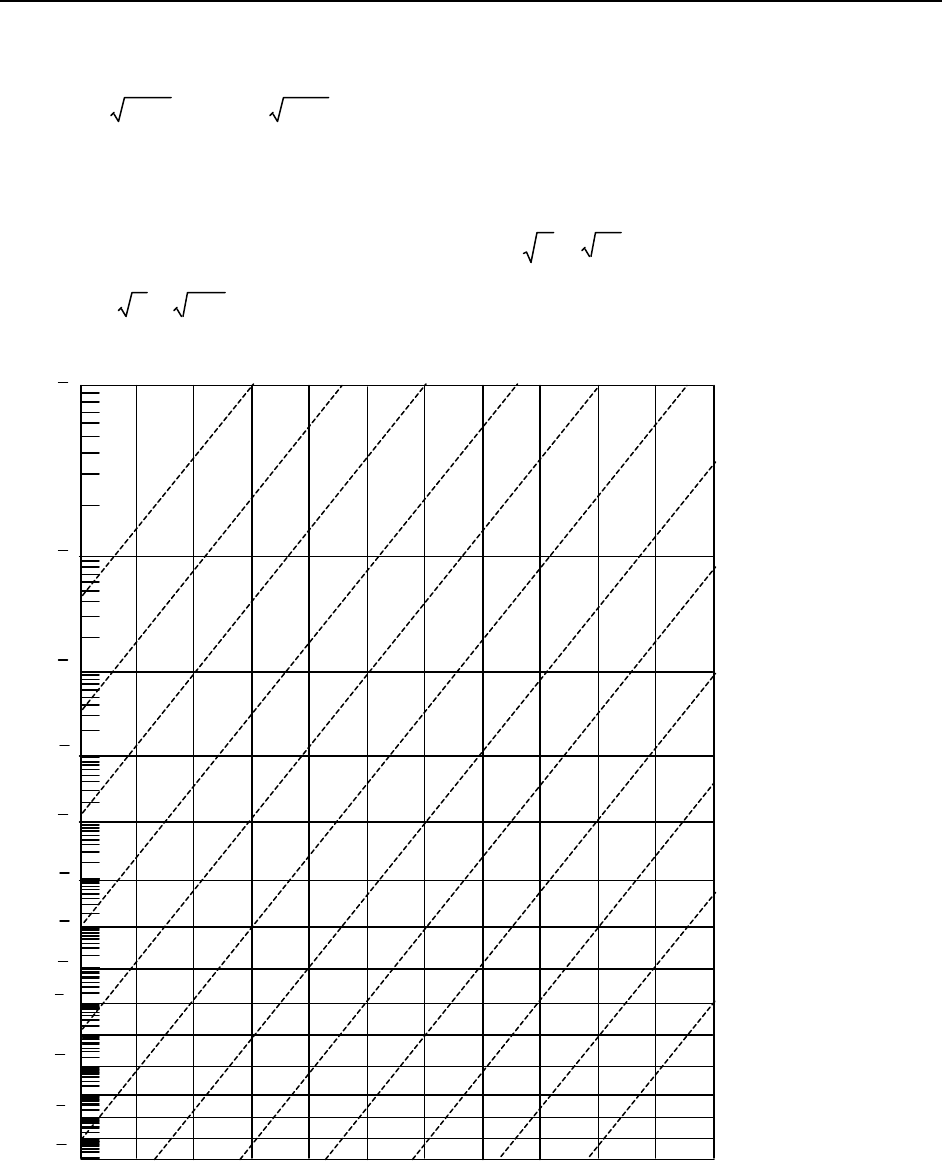
Figure S-2. Specially distorted scale so plots of BER versus signal Attenuation (electrical or
optical) are straight lines (parallel to the dashed lines) when the noise is Gaussian.
=============