


BERT Technical Articles
B-42 GB1400 User Manual
Sidebar article to Measure Error Rates Quickly and Accurately
Poisson Error Process
A Poisson process is one in which events are not dependent on each other, and conditions causing the
events don't change with time. Raindrops hitting a skylight is an example of a Poisson process. The
impact of one raindrop doesn't affect the arrival time of another. If we know the average rate r of a
Poisson error process, then we have completely characterized it. In particular, if errors are measured for a
period T, the probability of measuring n errors is given by
p n
rT
n
e
n
rT
( )
( )
!
=
−
.
(For a proof of this, see Probability, Random Variables, and Stochastic Processes by Papoulis, McGraw-
Hill, 1965.)
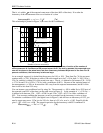
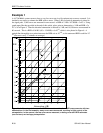
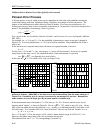
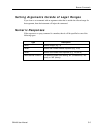
For example, for r = 5 / hr and T = 1 hr, the probability of measuring n errors in one hour is plotted in
Figure S-1a. It is most probable that n = 4 or 5 errors will be measured. The probabilities for all the n
sum to one.
If the one-hour test is repeated many times, the mean (or expected) number of errors is
µ = rT.
For the case r = 5 / hr and T = 1 hr, on average µ = 5 errors will be measured. As the test is repeated
many times for the same r and T, the standard deviation of the measurement n is given by
σ µ
= = rT . (see Papoulis for a proof of this).
In this case σ =
5
= 2.24, which is 45% of µ (see Figure S-1b).
0
1 2 3 4 5 6 7 8 9 10 11 12 13
0
0.02
0.04
0.06
0.08
0.1
0.12
0.14
0.16
0.18
p
( )n
n
µ
σ
σ
σ
= 0.45
µ
(S-1a)
0 10 20 30 40 50 60 70 80 90 100 110 120 130
0
0.01
0.02
0.03
0.04
0.05
0.06
p
( )n
n
σ
µ
= 0.14
σ µ
σ
(S-1b)
Figure S-1a. Probability p(n) of n errors in one hour for an average of 5 per hour. The error
process is Poisson. About 68% of the time n is no more than
σ σ
away from the mean value
µµ
= 5.
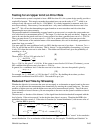
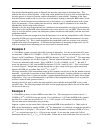
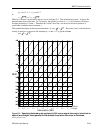
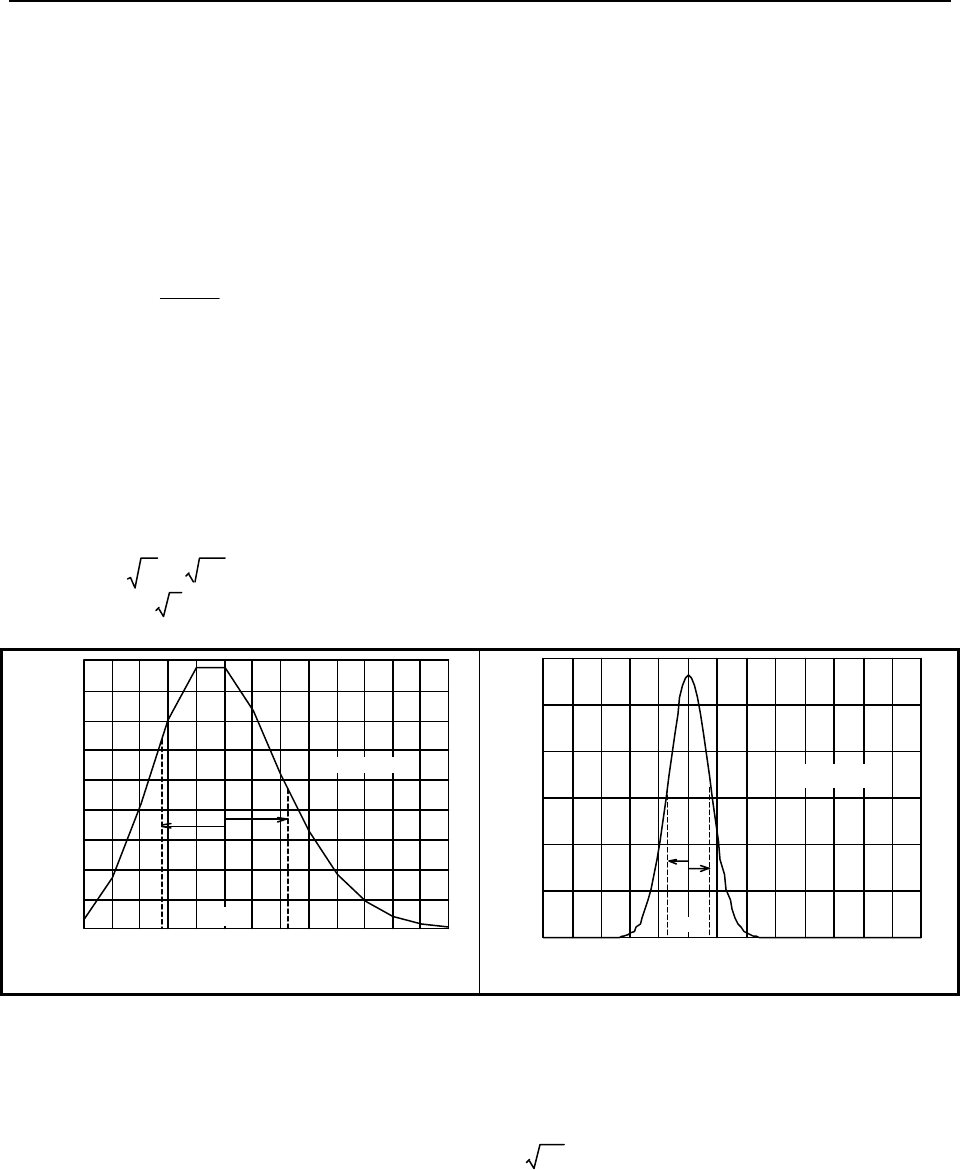
Figure S-1b. Probability p(n) of n errors in ten hours for an average of 5 per hour. Because the
mean number of errors is larger (
µµ
= 50),
σσ
is now smaller in relation to
µµ
.
If the measurement time is increased to T = 10 hr, then µ = 5 × 10 = 50 errors, and the curve of p(n)
becomes much "tighter", as shown in Figure B. Now σ =
50
= 7.07, which is only 14% of µ. About
68% of the area under the curve lies between n = µ − σ and µ + σ, indicating that 68% of the time n will
lie in this range. If we consider 68% to be "most of the time," then we can write the "bounds" on n as
µ − σ < n < µ + σ.
For r = 5 / hr and T = 10 hr, the range is ±14%, which is better than the range of ±45% for T = 1 hr.
However, the tighter range came at the cost of ten times the test time.
The estimated error rate r' = n / T is correspondingly "bounded" by