BERT Technical Articles
GB1400 User Manual B-33
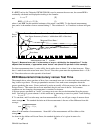
If a BERT such as the Tektronix GB700/ GB1400 is used to measure the error rate, the current BER is
continually calculated and displayed according to the formulas
r' = n / T (2)
and
BER' = r' / f
b
= (n / T) / f
b
, (3)
where r' and BER' are the measured estimates of the actual r and BER, T is the elapsed measurement
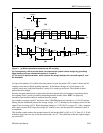
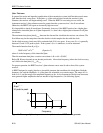
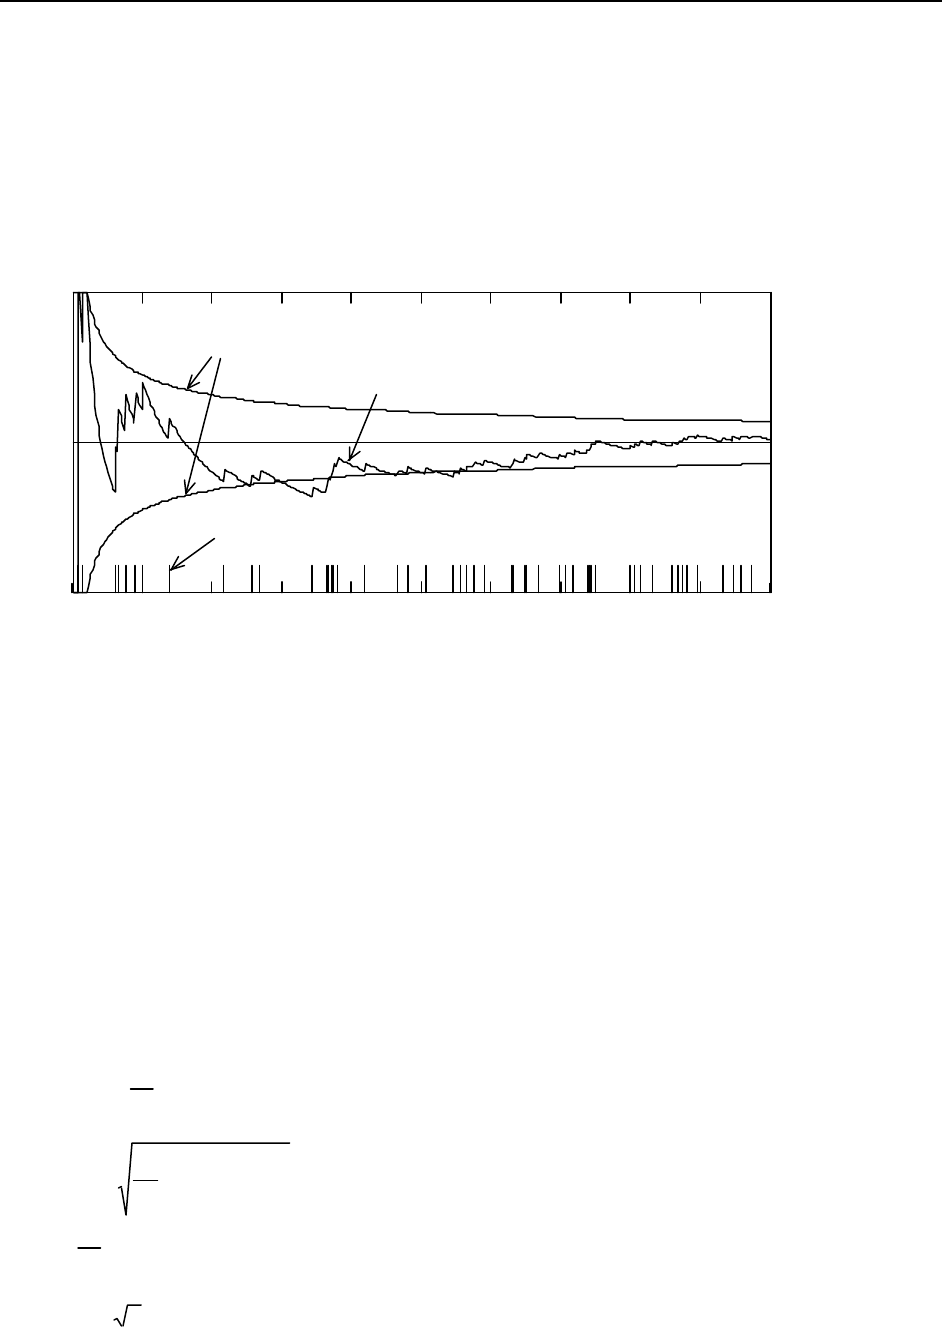
time, and n is the number of errors counted during T. The variation of r' as T increases is shown in Figure
2.
0 1 2 3 4 5 6 7 8 9 10
0
5
10
Measured Error Rate r'
One-Sigma Inaccuracy Limits ( within them 68% of the time)
Error times
Errors
per hr
Measurement Time in hours
T
r'
Figure 2. Measured error rate r' is the number of errors n divided by the elapsed time T. As the
elapsed time increases, r' approaches some "actual" rate (about five per hour in this example).
For short measurement times r' varies wildly, but it settles down to about 5 / hr as time increases. When
does r' settle down to the actual error rate r, if ever? Does the system meet the requirement that r < 5.58 /
hr? Does the test have to take upwards of ten hours?
BER Measurement Inaccuracy versus Test Time
The example above raises questions of how close a measured error rate is to the actual error rate and how
long it takes to get there. We can get quantitative answers if we make some assumptions about the
process producing the errors. Errors produced by noise are usually a Poisson process (see the sidebar on
Poisson Errors). This means the errors are unrelated; they do not come in bursts. It also means
conditions are not changing; the temperature is constant, for instance.
A Poisson process presumes an "actual" or average error rate r that can be determined from the process
itself. Our task is to get an estimate r' of this actual rate by measuring n errors in a period T and dividing:
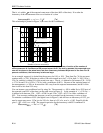
r' = n / T. (4)
If T is one hour, and if we take many one-hour measurements of n, we will get a range of answers about
some average
n
. The standard deviation σ of the measurements is the rms of the difference from this
average:
σ
≡ −
=
∑
1
2
1
N
n n
i
i
N
( )
__
, (5)
where N is the number of measurements. About 68% of the measurements will lie within σ of the
average
n
.
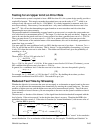
As shown in the sidebar on Poisson Errors, the standard deviation of n is given in terms of n:
σ ≈
n
(6)


