Monitor System Access and Performance
465
ProSecure Unified Threat Management (UTM) Appliance
3. Click Apply to save your settings.
4. For the multiple WAN port models only, click the WAN2 Traffic Meter, WAN3 Traffic Meter
(UTM150 only), or WAN4 Traffic Meter (UTM150 only) submenu tab to display the
corresponding WAN Traffic Meter screen. These screens are identical to the WAN1 Traffic
Meter screen (see Figure 271 on page 463).
5. For the multiple WAN port models only, repeat Step 2 and Step 3 for the additional WAN
interface or interfaces.
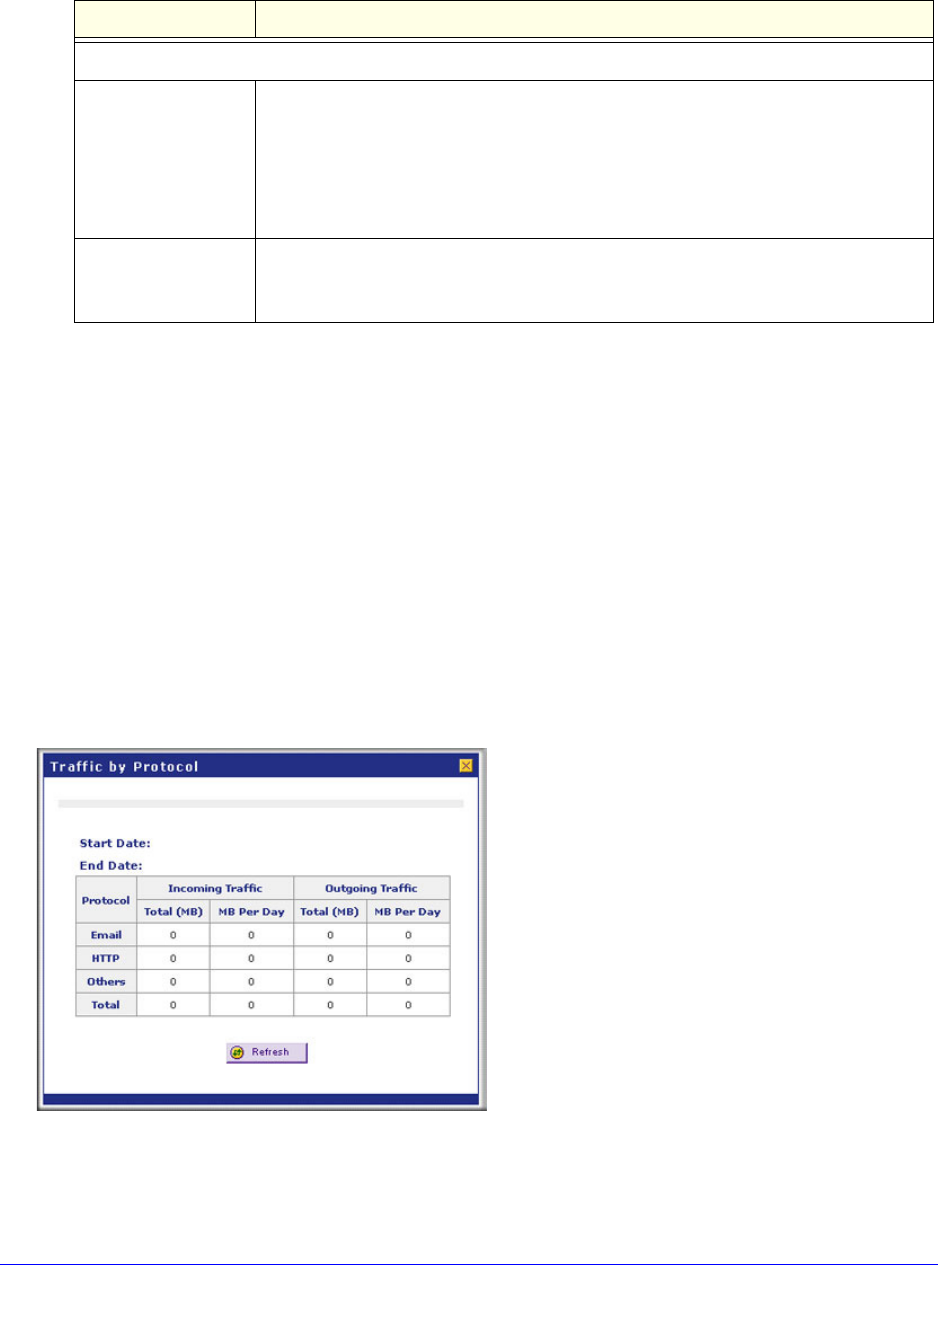
To display a report of the Internet traffic by type, click the Traffic by Protocol option arrow in
the upper right of the WAN Traffic Meter screen (single WAN port models) or in the upper
right of one of the WAN Traffic Meter screens (multiple WAN port models). The Traffic by
Protocol screen displays in a pop-up screen. The incoming and outgoing volume of traffic for
each protocol and the total volume of traffic are displayed. Traffic counters are updated in
MBs; the counter starts only when traffic passed is at least 1 MB. In addition, the pop-up
screen displays the traffic meter’s start and end dates.
Figure 272.
When Limit is reached
Block Traffic Select one of the following radio buttons to specify which action the UTM performs
when the traffic limit has been reached:
• Block All Traffic. All incoming and outgoing Internet and email traffic is
blocked.
• Block All Traffic Except E-Mail. All incoming and outgoing Internet traffic is
blocked, but incoming and outgoing email traffic is still allowed.
Send e-mail alert An email alert is sent when traffic is blocked. Ensure that emailing of logs is enabled
on the Email and Syslog screen (see Configure and Activate System, Email, and
Syslog Logs on page 467).
Table 114. WAN traffic meter settings (continued)
Setting Description


