Monitor System Access and Performance
513
ProSecure Unified Threat Management (UTM) Appliance
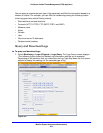
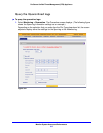
3. Click one of the following action buttons:
• Search. Query the log according to the search criteria that you specified, and view
the log through the web management interface, that is, onscreen.
• Download. Query the log according to the search criteria that you specified, and
download the log to a computer.
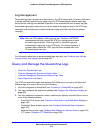
Example: Use the Logs to Identify Infected Clients
You can use the UTM logs to help identify potentially infected clients on the network. For
example, clients that are generating abnormally high volumes of HTTP traffic might be
infected with spyware or other malware threats.
To identify infected clients that are sending spyware in outbound traffic, query the UTM
malware logs and see if any of your internal IP addresses are the source of spyware.
To identify infected clients:
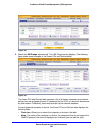
1. On the Log Query screen (see Figure 301 on page 509), select Traffic as the log type.
2. Select the start date and time from the drop-down lists.
3. Select the end date and time from the drop-down lists.
4. Next to Protocols, select the HTTP check box.
5. Click Search. After a few minutes, the log displays onscreen.
6. Check if there are clients that are sending out suspicious volumes of data, especially to the
same destination IP address, on a regular basis.
If you find a client exhibiting this behavior, you can run a query on that client’s HTTP traffic
activities to get more information. Do this by running the same HTTP traffic query and
entering the client IP address in the Client IP field.
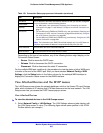
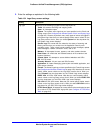
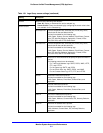
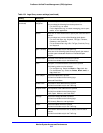
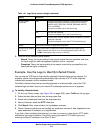
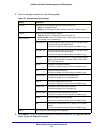
Search Criteria
(continued)
Event The type of event that is queried. These events are the same
events that are used to indicate the syslog server severity:
EMERG, ALERT, CRITICAL, ERROR, WARNING, NOTICE,
INFO, and DEBUG.
This field is available only for the Service log.
URL The URL that is queried.
This field is available only for the Content filters log.
Content The user name, client IP address, server IP address, or domain
name that is queried.
This field is available only for the HTTPS Smart Block log.
Display The maximum number of pages that is displayed.
Download Log (zipped)
File Format
Select a radio button to specify the format to download the zipped log file:
• CSV. Download the log file as a comma-separated values (CSV) file.
• HTML. Download the log file as an HTML file.
Table 134. Logs Query screen settings (continued)
Setting Description


