


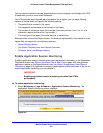
Monitor System Access and Performance
526
ProSecure Unified Threat Management (UTM) Appliance
URL Filtering by Time For the HTTPS and HTTP protocols separately, a chart and a table with the
number of blocked attempts to access URLs that are on the blacklist.
File Blocked by Time For each of the three web server protocols separately, a chart and a table
with the number of blocked files (FTP files, HTTPS attachments, or HTTP
attachments).
Malware by Time For each of the three web server protocols separately, a chart and a table
with the number of detected malware incidents.
Top n Domain by Bandwidth For all web server protocols combined, a chart and a table with the domains
for which most bandwidth was consumed and the size of the bandwidth
consumed (expressed in bytes), and drill-down links to the users who
accessed the domains.
When you click the drill-down link for a domain, the User by Bandwidth chart
and table display, showing the users who accessed the domain. For each
user, the user login name (including the domain to which the user belongs)
and the size of the bandwidth consumed (expressed in bytes) are shown.
Top n Category by Bandwidth For all web server protocols combined, a chart and a table with the web
categories for which most bandwidth was consumed and the size of the
bandwidth consumed (expressed in bytes), and drill-down links to the users
who accessed the web categories.
When you click the drill-down link for a web category, the Users by
Bandwidth chart and table display, showing the users who accessed the
web category. For each user, the user login name (including the domain to
which the user belongs) and the size of the bandwidth consumed
(expressed in bytes) are shown.
Top n Blocked Domains For all web server protocols combined, a chart and a table with the domains
that were blocked most often, including the number of blocked requests, and
drill-down links to the users who requested them.
When you click the drill-down link for a domain, the Blocked Users by
Requests chart and table display, showing the users who requested the
domain. For each user, the user login name (including the domain to which
the user belongs) and the number of blocked requests are shown.
Top n Blocked Categories For all web server protocols combined, a chart and a table with the web
categories that were blocked most often, including the number of blocked
requests, and drill-down links to the users who requested them.
When you click the drill-down link for a domain, the Blocked Users by
Requests chart and table display, showing the users who requested the
domain. For each user, the user login name (including the domain to which
the user belongs) and the number of blocked requests are shown.
Top n Domains By Request For all web server protocols combined, a chart and a table with the domains
that were requested most often, including the number of times that they
were requested, and drill-down links to the users who requested them.
When you click the drill-down link for a domain, the Users by Requests chart
and table display, showing the users who requested the domain. For each
user, the user login name (including the domain to which the user belongs)
and the number of blocked requests are shown.
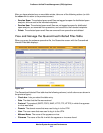
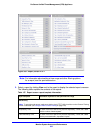
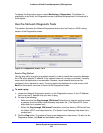
Table 137. Report screen: report template information (continued)
Report template Information reported for the specified time range