


Monitor System Access and Performance
477
ProSecure Unified Threat Management (UTM) Appliance
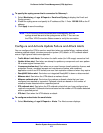
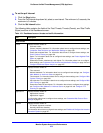
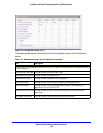
3. Click Apply to save your settings.
Monitor Real-Time Traffic, Security, and Statistics
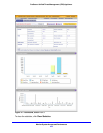
The Dashboard screen lets you monitor the real-time security scanning status with detected
network threats, detected network traffic, and service statistics for the six supported protocols
(HTTP, HTTPS, FTP, SMTP, POP3, and IMAP). In addition, the screen displays statistics for
the most recent five and top five malware threats detected, IPS signatures matched,
applications blocked, web categories blocked, and spam emails blocked.
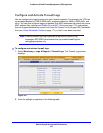
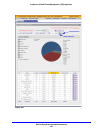
To display the Dashboard screen, select Monitoring > Dashboard. Because of the size of
the Dashboard screen, it is divided and presented in this manual in three figures (the
following figure, Figure 278 on page 480, and Figure 279 on page 482), each with its own
table that explains the fields.
Except for setting the poll interval and clearing the statistics, you cannot configure the fields
on the Dashboard screen. Any changes need to be made on other screens.
Note: Adobe Flash player 10 or later is required to display the graphics.
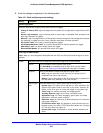
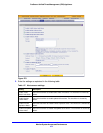
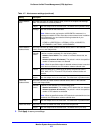
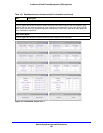
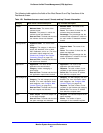
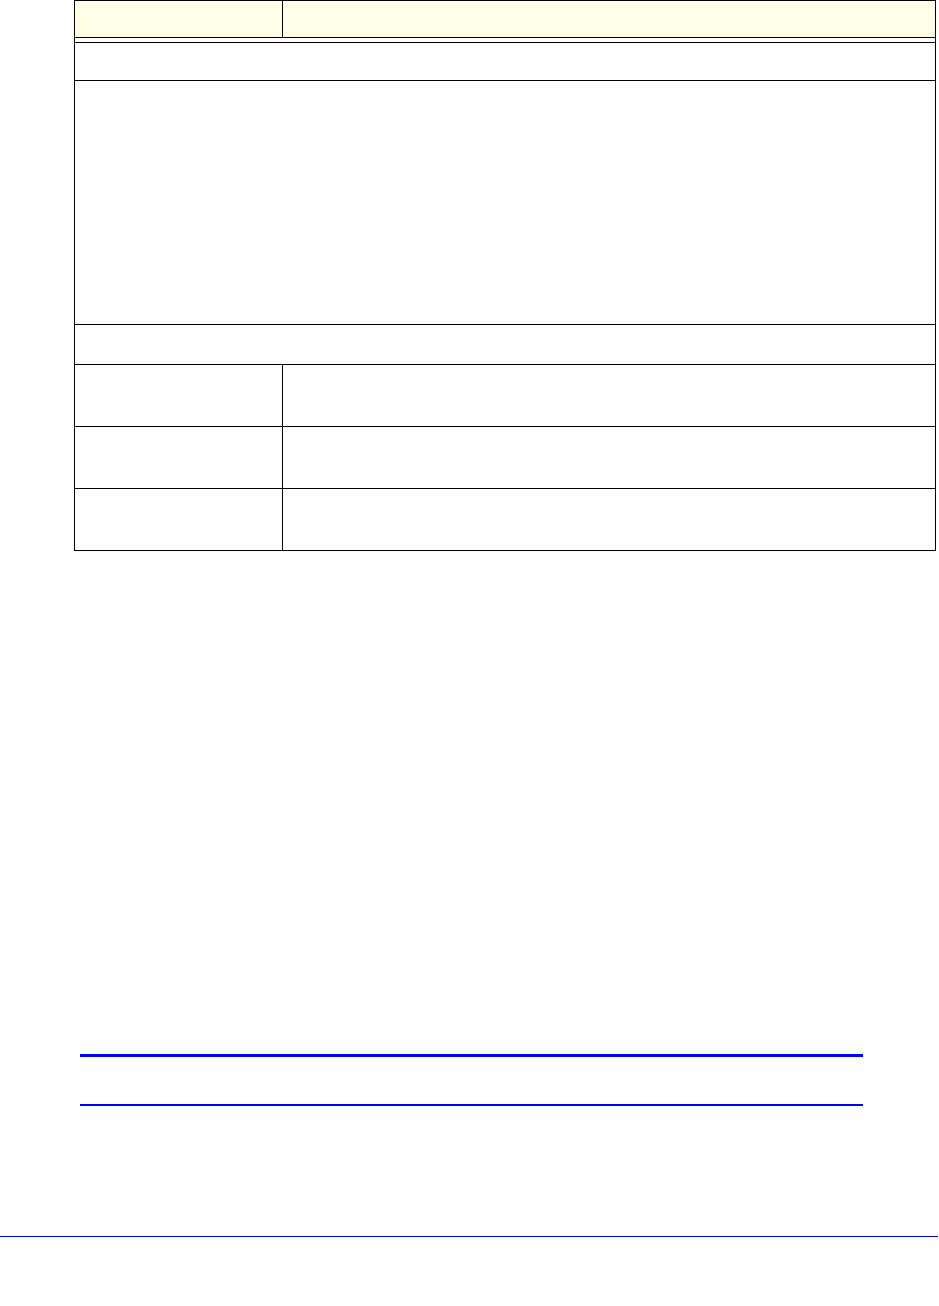
Table 118. Firewall Logs screen settings
Setting Description
Routing Logs
In the Accepted Packets and Dropped Packets columns, select check boxes to specify which traffic is
logged:
• LAN to WAN
• LAN to DMZ
• DMZ to WAN
• WAN to LAN
• DMZ to LAN
• WAN to DMZ
• VLAN to VLAN
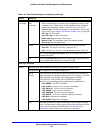
Other Event Logs
Source MAC Filter Select this check box to log packets from MAC addresses that match the source
MAC address filter settings.
Session Limit Select this check box to log packets that are dropped because the session limit
has been exceeded.
Bandwidth Limit Select this check box to log packets that are dropped because the bandwidth
limit has been exceeded.