


Monitor System Access and Performance
529
ProSecure Unified Threat Management (UTM) Appliance
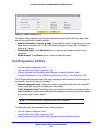
Schedule, Email, and Manage Reports
To schedule automatic generation and emailing of reports:
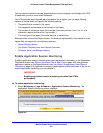
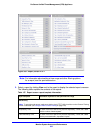
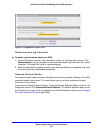
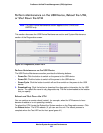
1. Select Monitoring > Logs & Reports > Report. The Report screen displays. (The
following two figures show only the Schedule Reports and Report History sections of the
Report screen.)
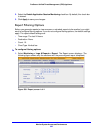
Figure 310. Report, screen 3 of 4
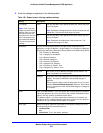
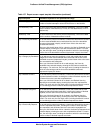
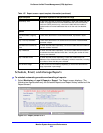
Blacklist By Time For the POP3 and SMTP protocols separately, a chart and a table with the
number of blocked emails from email addresses that are on the blacklist,
and for the SMTP protocol only, a chart and a table with the number of
blocked emails from email addresses that are on the real-time blacklist
(RBL).
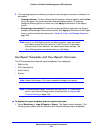
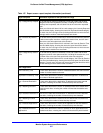
System
Total Bandwidth Usage By
Time
A chart and a table with the consumed bandwidth, expressed in bytes.
Top n User By Bandwidth A chart and a table with the IP addresses that consume most bandwidth,
expressed in bytes.
Total Malware Incidents By
Time
For email and web traffic separately, a chart and a table with the number of
detected malware incidents.
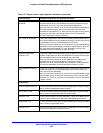
Top n Malwares For email and web traffic separately, a chart and a table with the names of
the malware that were detected most often, including the number of times
that they were detected.
Top n Infected Clients For email and web clients separately, a chart and a table with the IP
addresses of the clients that were infected by malware most often, including
the number of times that they were infected.
CPU & Mem Usage For the UTM’s CPU and memory separately, a chart and a table with the
usage, expressed in percentage.
Table 137. Report screen: report template information (continued)
Report template Information reported for the specified time range