Monitor System Access and Performance
469
ProSecure Unified Threat Management (UTM) Appliance
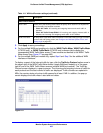
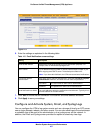
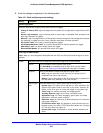
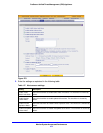
2. Enter the settings as explained in the following table:
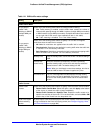
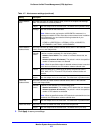
Table 116. Email and Syslog screen settings
Setting Description
System Logs Option
Select the check boxes to specify which system events are logged:
• Change of Time by NTP. Logs a message when the system time changes after a request from an NTP
server.
• Secure Login Attempts. Logs a message when a secure login is attempted. Both successful and
failed login attempts are logged.
• Reboots. Logs a message when the UTM has been rebooted through the web management interface.
(No message is logged when the Factory Defaults reset button has been pressed.)
• All Unicast Traffic. All incoming unicast packets are logged.
• All Broadcast/Multicast Traffic. All incoming broadcast and multicast packets are logged.
• WAN Status. WAN link status–related events are logged.
• Resolved DNS Names. All resolved DNS names are logged.
Email Logs to Administrator
Note: When you have integrated a ReadyNAS with the UTM, the UTM cannot send the logs to an email
address.
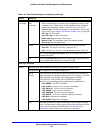
Enable Select this check box to enable the UTM to send a log file to an email address.
Send to The email address of the recipient of the log file.
Click Send Now to immediately send the logs, which you first need to
specify in the Select Logs to Send subsection (see later in this table).
Frequency Select a radio button to specify how often the log file is sent:
• Daily. Logs are sent daily at the time that you specify from the
drop-down lists (hours and minutes).
• Weekly. Logs are sent weekly at the day and time that you specify from
the drop-down lists (weekday, hours, and minutes).
Select Logs to
Send
Select the check boxes to specify which logs are sent by email:
• System Logs. The system event logs that you have specified in the
System Logs Options section at the top of the screen. However, by
default, many more types of events are logged in the system logs.
• Traffic Logs. All scanned incoming and outgoing traffic.
• Anomaly Behavior Logs. All port scan and DDoS events.
• Application Logs. All instant messaging, peer-to-peer and media
applications, and tools access violations.
• Email filter Logs. All emails that are blocked because of file extension
and keyword violations.
• HTTPS Smart Block logs. All attempts to access domains that are
blocked as part of an active HTTPS Smart Block profile (see Configure
HTTPS Smart Block on page 212).
• Content Filter Logs. All attempts to access blocked websites and
URLs.


