


Monitor System Access and Performance
486
ProSecure Unified Threat Management (UTM) Appliance
View Status Screens
• View the System Status
• View the Active VPN Users
• View the VPN Tunnel Connection Status
• View the Active PPTP and L2TP Users
• View the Port Triggering Status
• View the WAN, xDSL, or USB Port Status
• View Attached Devices and the DHCP Leases
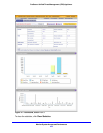
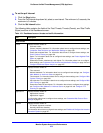
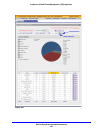
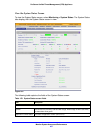
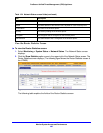
View the System Status
When you start up the UTM, the default screen that displays is the System Status screen.
The System Status screen, Network Status screen, Router Statistics screen, Detailed Status
screen, VLAN Status screen, and xDSL Statistics screen (UTM9S and UTM25S only) provide
real-time information about the following important components of the UTM:
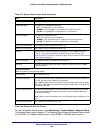
• CPU, memory, and hard disk status
• ReadyNAS and quarantine status
• Services status (indicating whether the protocols are scanned for malware) and the
number of active connections per service
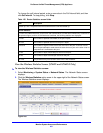
• Firmware versions and update information of the UTM, software versions and update
information of the components, license expiration dates for each type of license, and
hardware serial number
• WAN and LAN port information
• Interface statistics
• VLAN status, including port memberships
• xDSL statistics (UTM9S and UTM25S only)
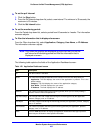
These status screens are described in the following sections:
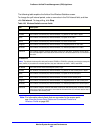
• View the System Status Screen
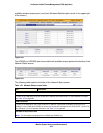
• View the Network Status Screen
• View the Router Statistics Screen
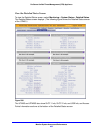
• View the Wireless Statistics Screen (UTM9S and UTM25S Only)
• View the Detailed Status Screen
• View the VLAN Status Screen
• View the xDSL Statistics Screen (UTM9S and UTM25S Only)