Monitor System Access and Performance
480
ProSecure Unified Threat Management (UTM) Appliance
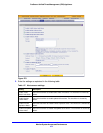
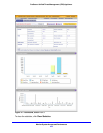
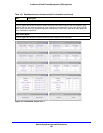
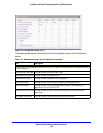
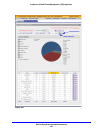
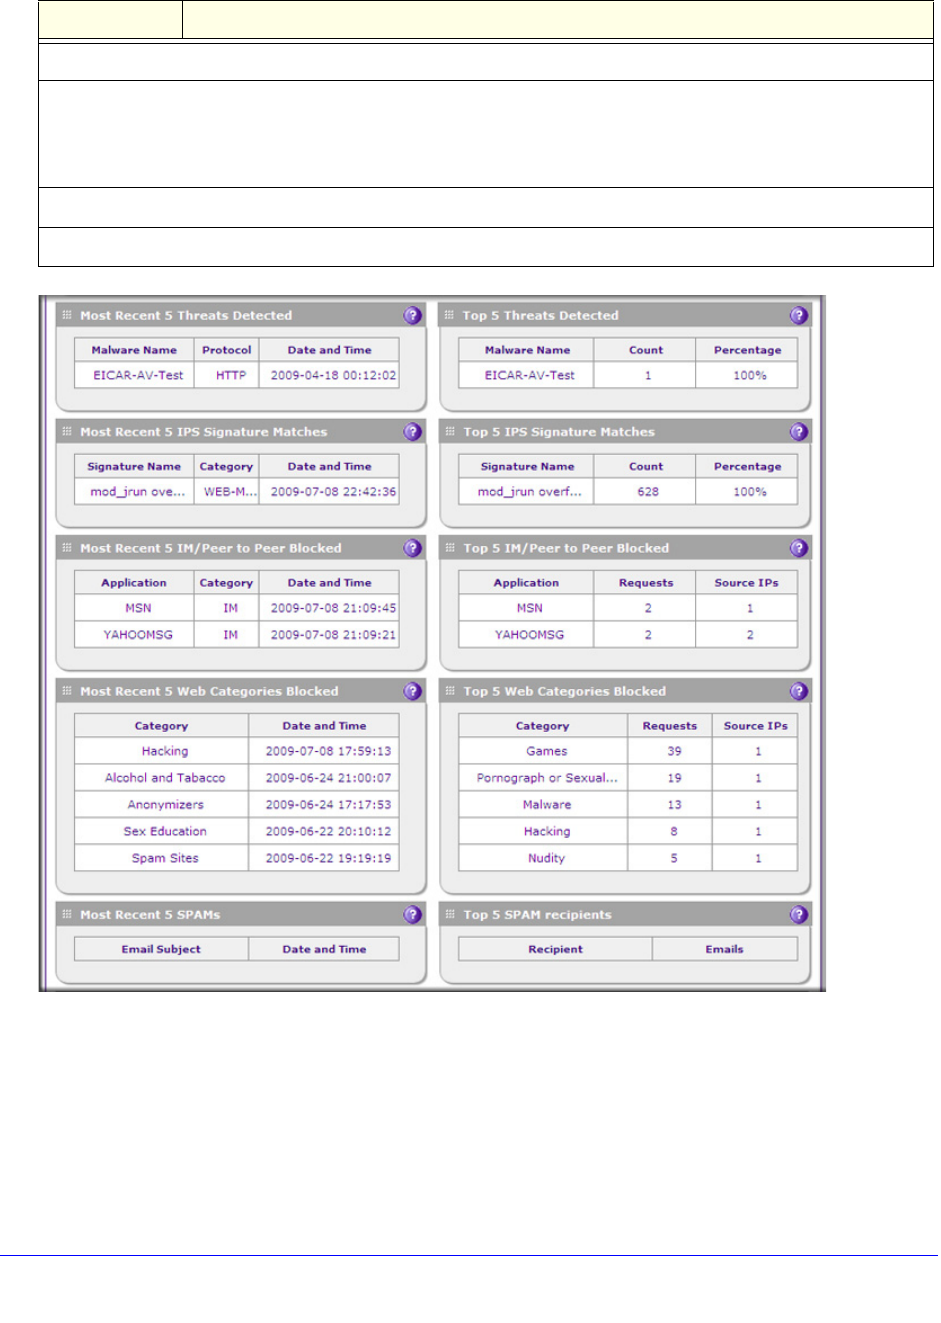
Figure 278. Dashboard, screen 2 of 3
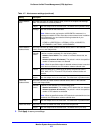
Threats (Counts)
This is a graphic that shows the relative number of threats and access violations over the last week, using
different colors for the various components, most of which are self-explanatory: Email Filter, Spam, IPS Sig
Match (which stands for IPS signatures matched), Web Malware, Email Virus, Application Block, Web URL
Block, and Web Content Block.
Total Traffic (Bytes)
This is a graphic that shows the relative amount of traffic in bytes over the last week.
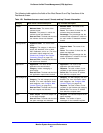
Table 119. Dashboard screen: threats and traffic information (continued)
Item Description


