


CHP. 16 PREVIEWING AND ANALYZING VIDEO
297
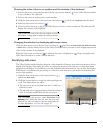
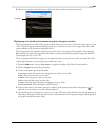
5.
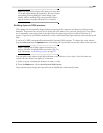
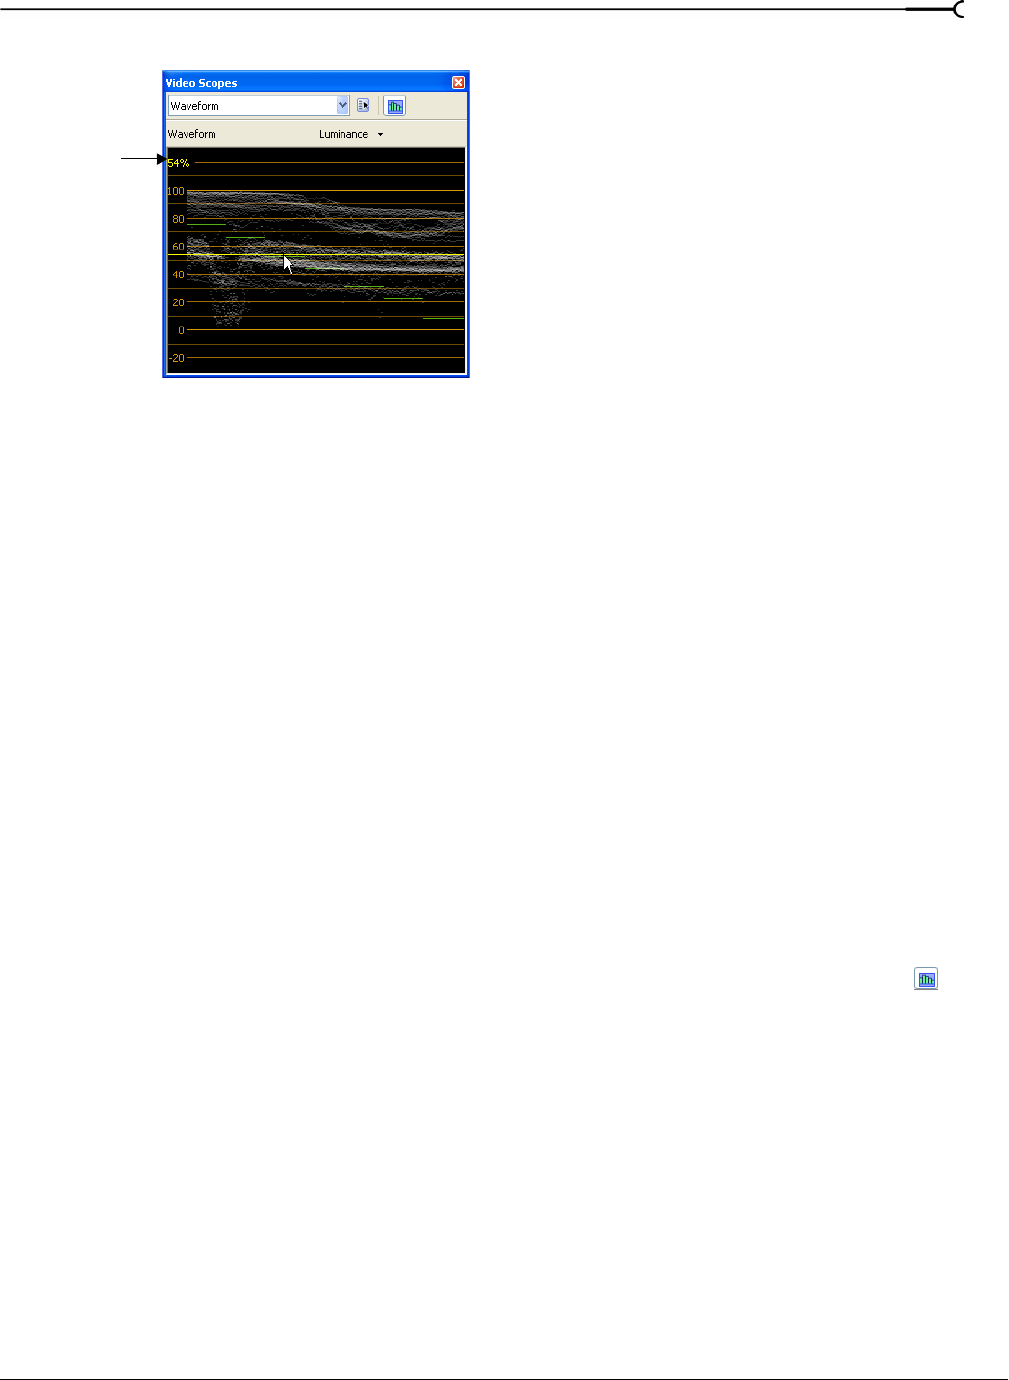
Hover over a portion of the monitor to display the luma value at the pointer position:
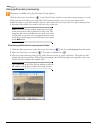
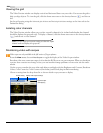
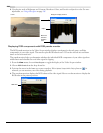
Displaying color levels and contrast using the histogram monitor
The histogram monitor in the Video Scopes window allows you to monitor color levels and contrast of your
video. Use the histogram before rendering your project to find and correct out-of-range values that could
cause problems on the destination playback device.
The bar graph plots the number of pixels that exist for each color intensity. For example, when using the
Blue setting, the vertical axis represents the number of pixels, and the horizontal axis represents the RGB
color range from 0,0,0 to 0,0,255.
To get acquainted with the histogram, use an external monitor to preview your video and watch the video
output and histogram as you use plug-ins to modify the colors.
1.
From the View menu, choose Video Scopes to toggle the display of the Video Scopes window.
2.
Choose Histogram from the drop-down list.
3.
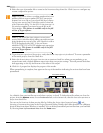
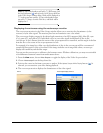
Choose a histogram type from the menu:
• Luminance: charts the luminance or brightness of colors in your video.
• Red: charts the red tones in your video.
• Green: charts the green tones in your video.
• Blue: charts the blue tones in your video.
• Alpha: charts the alpha channel (transparency) in your video.
• Luminance/R/G/B: stacks luminance and RGB charts.
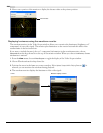
4.
Position the cursor in the frame you want to analyze. If the Update Scopes While Playing button ( ) is
selected, you can monitor your video during playback.
5.
Use the histogram to evaluate the colors in your video. The Mean value indicates the average intensity of
all pixels in the graph, and the
Standard Deviation value indicates the average percentage by which pixels in
the graph vary from the
Mean value.
Luma value